Skip to content
Global-Maritime-Hub- Logo
X-twitter Linkedin Youtube
  • Home
  • Premium Content
  • Insights
  • Events
  • Industry Links
    • Broker
    • Certification
    • Consultant
    • Industry Association
    • Institute & Think Tank
    • Legal Experts
    • Official Institution / Body
    • Port & Port Authority
    • Recruitment Specialist
    • Research & Market Data
    • Shipping Company
    • Industry Blog
    • Trade Media
    • Training & Education
  • About Us
  • Other Hubs
    • GLOBAL LNG HUB
    • EUROPEAN GAS HUB
    • THE COAL HUB
    • GLOBAL HYDROGEN HUB
    • GLOBAL MINERALS HUB
  • FREE TRIAL
  • My account
  • Login
  • Home
  • Premium Content
  • Insights
  • Events
  • Industry Links
    • Broker
    • Certification
    • Consultant
    • Industry Association
    • Institute & Think Tank
    • Legal Experts
    • Official Institution / Body
    • Port & Port Authority
    • Recruitment Specialist
    • Research & Market Data
    • Shipping Company
    • Industry Blog
    • Trade Media
    • Training & Education
  • About Us
  • Other Hubs
    • GLOBAL LNG HUB
    • EUROPEAN GAS HUB
    • THE COAL HUB
    • GLOBAL HYDROGEN HUB
    • GLOBAL MINERALS HUB
  • FREE TRIAL
  • My account
  • Login
€0.00 0 Cart
Global-Maritime-Hub- Logo
€0.00 0 Cart
  • Home
  • Premium Content
  • Insights
  • Events
  • Industry Links
    • Broker
    • Certification
    • Consultant
    • Industry Association
    • Institute & Think Tank
    • Legal Experts
    • Official Institution / Body
    • Port & Port Authority
    • Recruitment Specialist
    • Research & Market Data
    • Shipping Company
    • Industry Blog
    • Trade Media
    • Training & Education
  • About Us
  • Other Hubs
    • GLOBAL LNG HUB
    • EUROPEAN GAS HUB
    • THE COAL HUB
    • GLOBAL HYDROGEN HUB
    • GLOBAL MINERALS HUB
  • FREE TRIAL
  • My account
  • Login
X-twitter Linkedin Youtube

© 2025 GlobalMaritimeHub | All Rights Reserved

Tag: supply chains

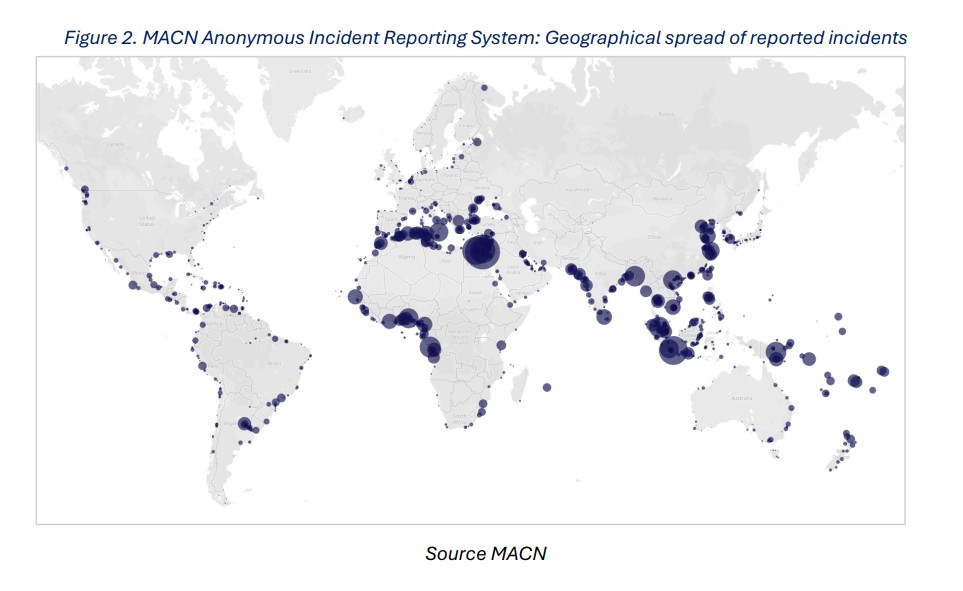
Port integrity map showing the global spread of reported maritime corruption incidents

Port integrity gaps persist across more than 300 ports worldwide

  • June 11, 2026
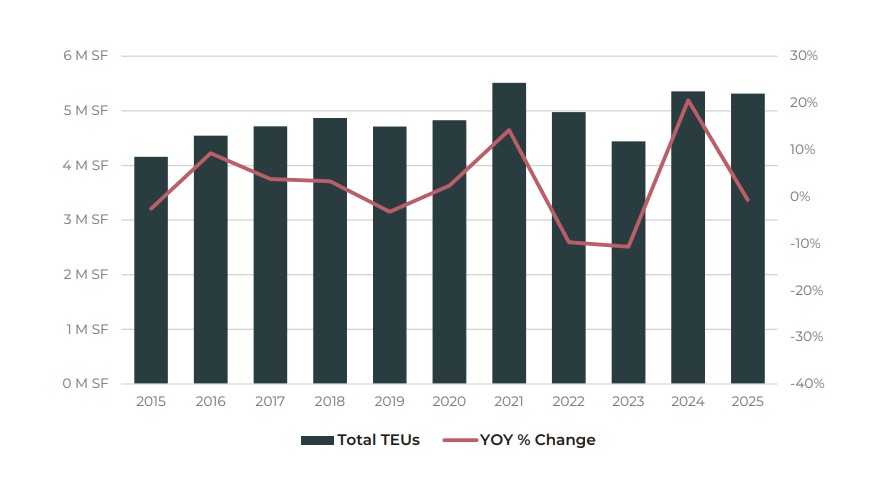
U.S. container ports total TEUs and year-over-year change from 2015 to 2025

U.S. container ports navigate a changing trade landscape

  • June 4, 2026
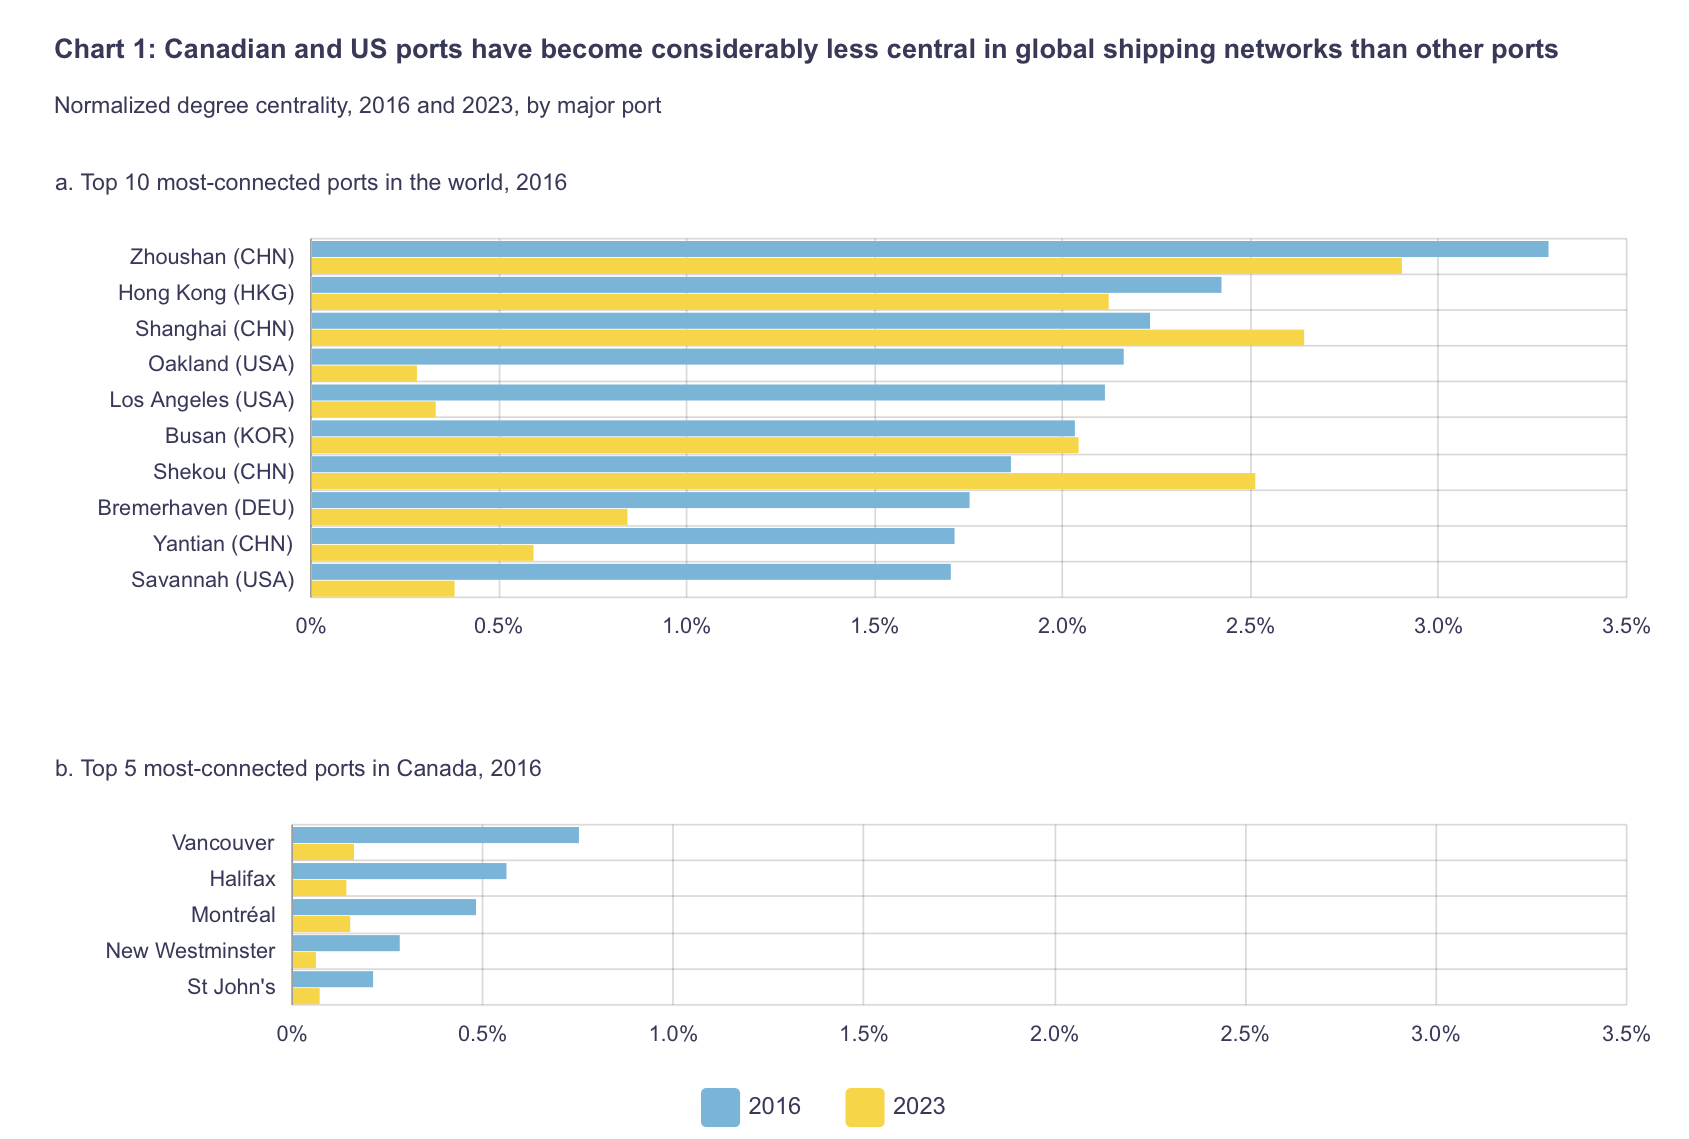
Horizontal bar chart comparing 2016 (blue) and 2023 (yellow) normalized degree centrality for the world's top 10 ports, showing Zhoushan highest, followed by Shanghai and Hong Kong; Canada section appears below with top 5 ports such as Vancouver, Halifax, Montréal, New Westminster, and St John's.

Canadian ports lose ground in global shipping networks

  • May 28, 2026
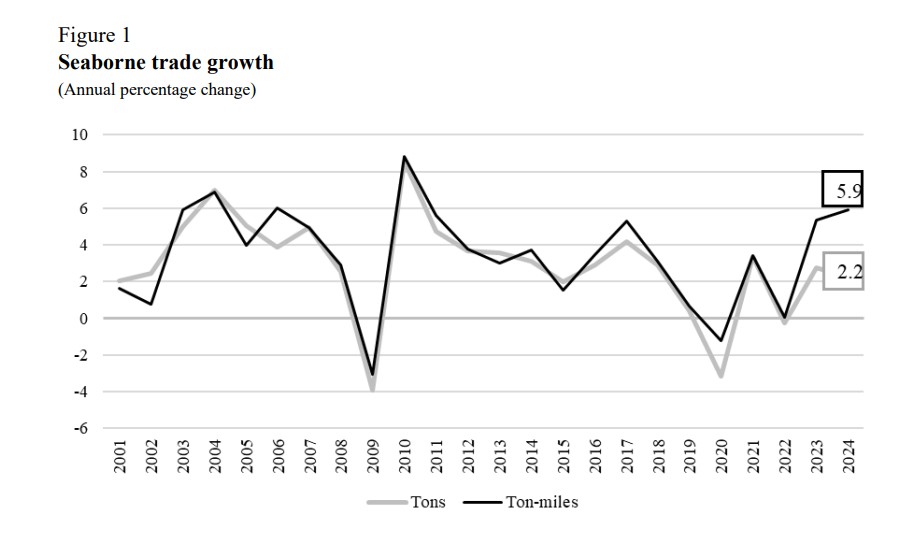
Seaborne trade growth chart showing tons and ton-miles rising in 2024

Maritime transport enters era of permanent disruption

  • May 21, 2026
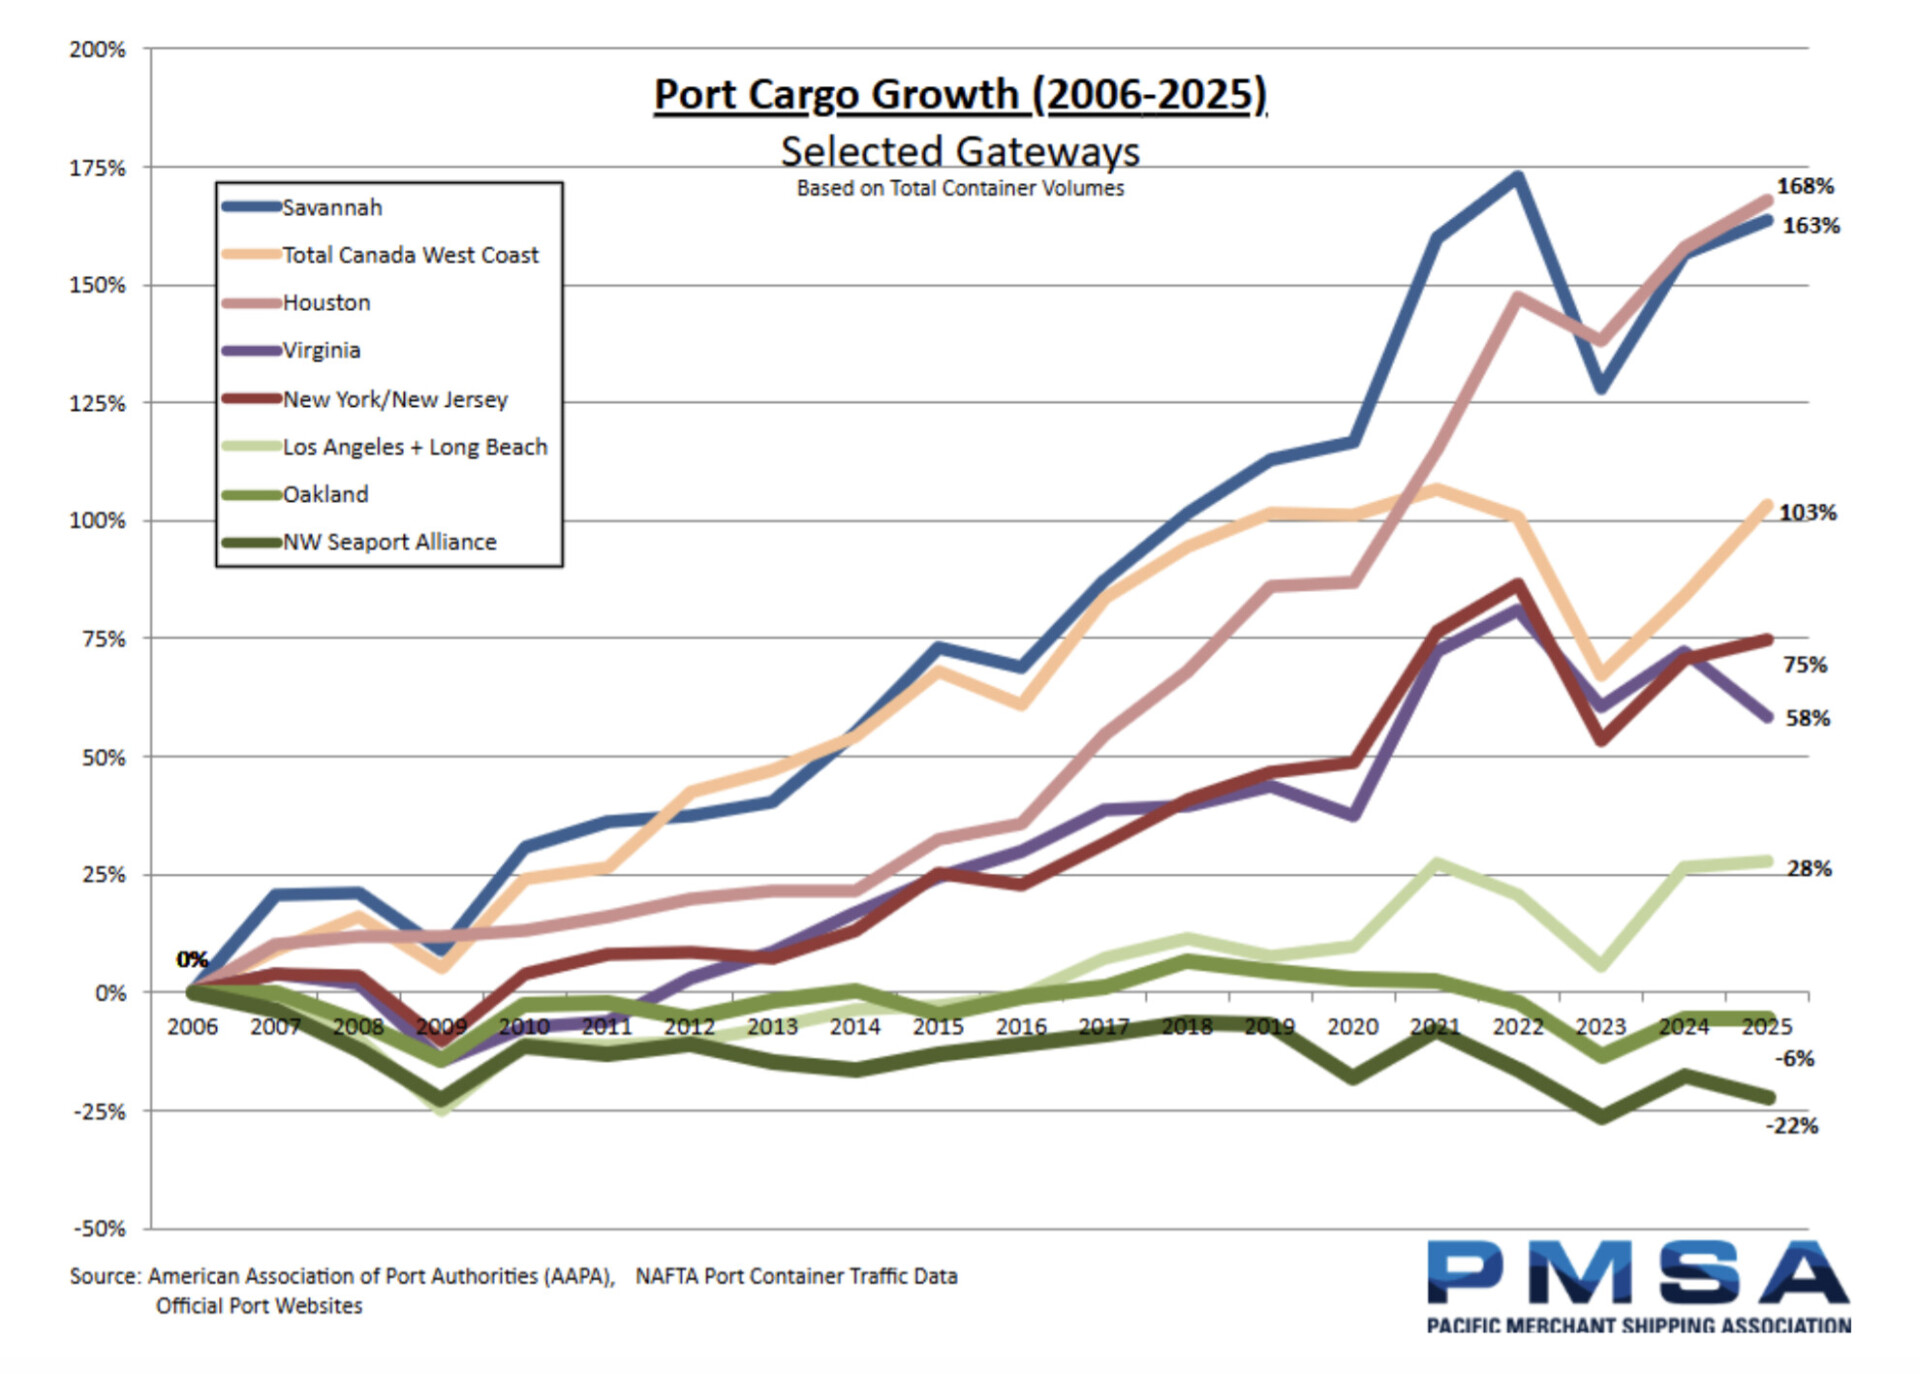
Line chart of Port Cargo Growth (2006–2025) for selected gateways, showing multiple port lines and end values around 168% for Savannah, 163% for NY/NJ, 103% for West Coast, and 58% for others. Note: based on total container volumes.

US West Coast ports regain momentum but face long road to market share recovery

  • May 15, 2026
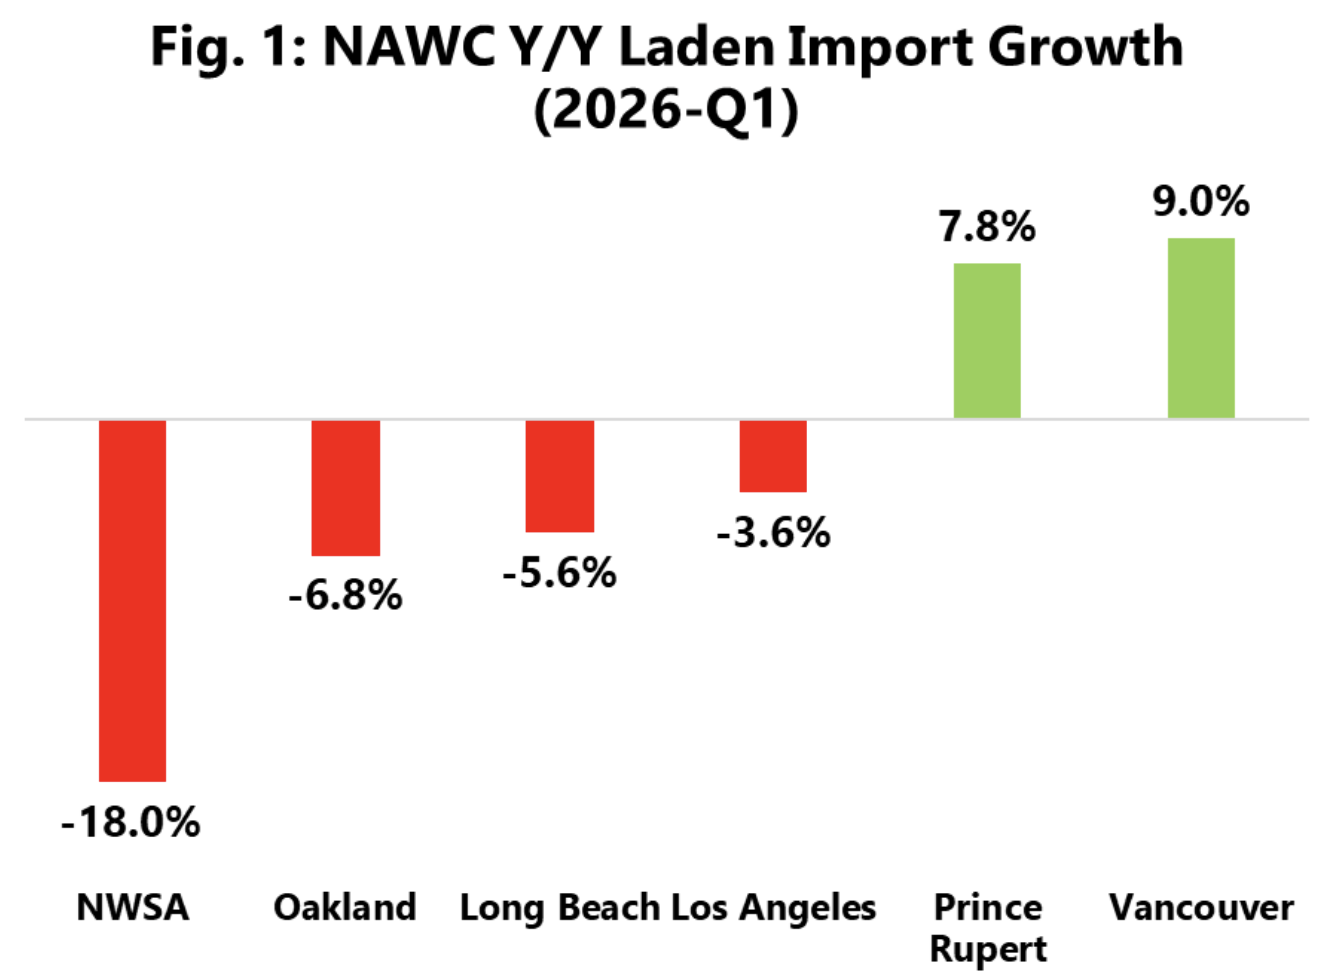
Bar chart of 2026-Q1 NAWC Laden Import Growth by port; shows declines at NWSA (-18%), Oakland (-6.8%), Long Beach (-5.6%), LA (-3.6%), and gains at Prince Rupert (7.8%), Vancouver (9%).

Transpacific container trade shifts north as Canadian ports gain market share

  • May 15, 2026
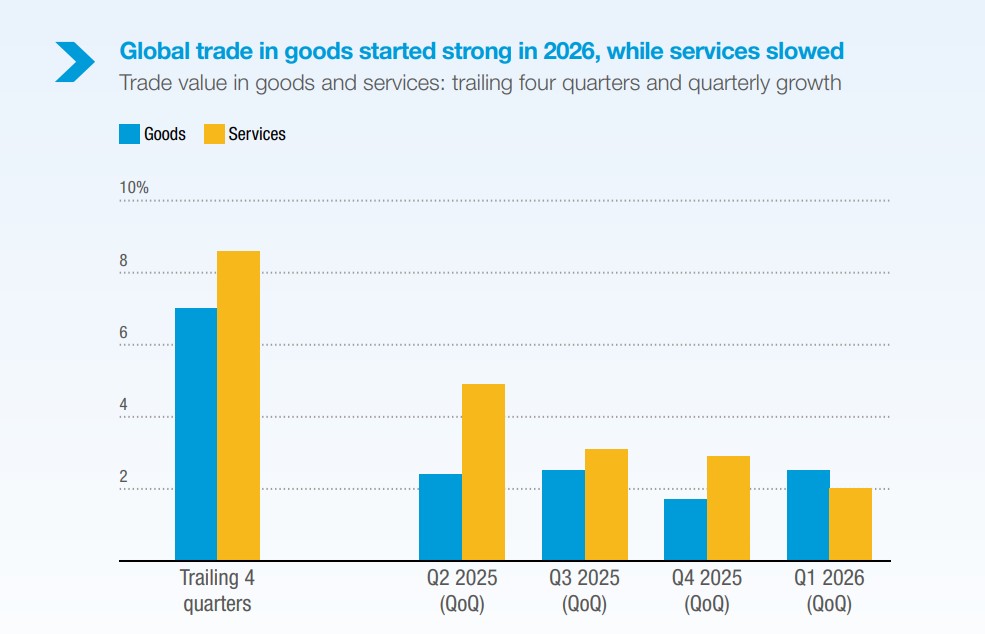
Global trade growth chart showing goods and services trends and nowcast for 2025 and early 2026

Global trade growth continues as fragmentation raises risks for 2026

  • April 30, 2026
Global trade outlook chart showing geopolitical and political risks as top threat to businesses

Global trade outlook 2026 enters a new era of geopolitical disruption

  • April 23, 2026
Global trade remains resilient as global connectedness holds steady despite rising geopolitical risks to shipping routes

Global trade holds up as supply chains adapt to rising risks on key shipping routes

  • March 26, 2026
Bar chart showing Chinese official financing for port equipment by type from 2000 to 2025, with general equipment and ship-to-shore handling equipment receiving the largest share at 47.6 percent or $2.1 billion.

China’s port financing expands global maritime dominance through strategic infrastructure and supply chains

  • March 19, 2026
Previous Page1 Page2 Page3 Page4 Page5 Next
Recent Post
Chart showing the percentage of the global container fleet absorbed by vessel delays from June 2012 to June 2026

Vessel delays absorb 1.7 million TEU of global capacity

August 20, 2026
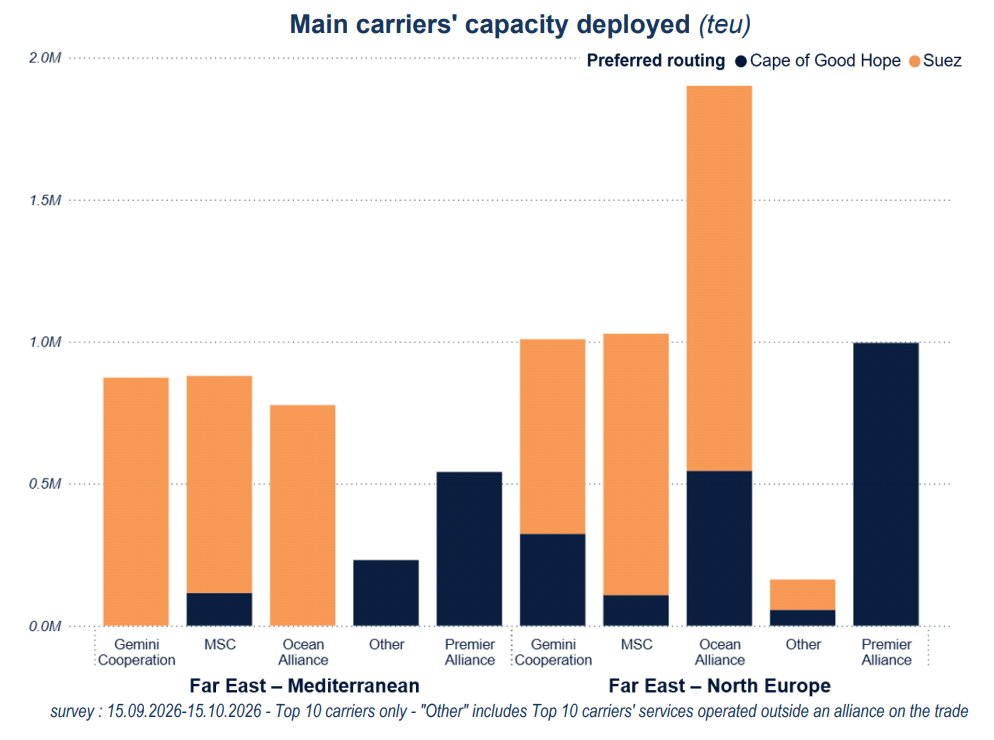
Chart comparing average vessel size and potential call size per European port for MSC, Gemini Cooperation, OCEAN Alliance and Premier Alliance on the Far East–North Europe trade.

Evergreen and HMM concentrate Far East–North Europe capacity in fewer ports

August 20, 2026
U.S. container imports by country of origin, July 2026

U.S. container imports rise as trade uncertainty persists

August 14, 2026
Chart comparing 2025 and 2026 carrier capacity deployment on Far East–India, Middle East and Red Sea services, with year-on-year capacity gains and losses.

Gulf conflict cuts Far East capacity by 14% year-on-year

August 13, 2026
Trending Posts

Port congestion: fewer ships waiting, but huge delays remain

February 17, 2022
container-ship

Global cellular container ship fleet exceeds 6,600 vessels

October 2, 2025
Annual-orders-by-propulsion-type

Dual-fuel ship orders plateau in the first ten months of 2025

October 16, 2025
Bunker prices

Bunker Prices Outlook, Week 14

April 8, 2021
Global-Maritime-Hub- Logo

Maritime market intelligence platform featuring 2,200+ reports, presentations and industry insights, with new content added every week. more info

Categories

  • Shipping Economic Trends & Regions
  • Ports & Terminals
  • Piracy & Security
  • Emissions, Fuel Technology & Environment
  • Economic Impact
  • Financing
  • Ship Building
  • Hinterland & Intermodal
  • Port Environmental Impact
  • Shipping Workforce

Recent Analysis

Vessel delays absorb 1.7 million TEU of global capacity

Evergreen and HMM concentrate Far East–North Europe capacity in fewer ports

U.S. container imports rise as trade uncertainty persists

Weekly Updates

Sign up to receive our weekly newsletter (each Thursday) with new shipping industry market reports, presentations & analysis.

Your subscription could not be saved. Please try again.
Your subscription has been successful.

By signing up, I agree to our TOS and Privacy Policy.

© 2026 GlobalMaritimeHub | All Rights Reserved

X-twitter Linkedin Youtube
We use cookies on our website to give you the most relevant experience by remembering your preferences and repeat visits. By clicking “Accept”, you consent to the use of ALL the cookies.
Cookie settingsACCEPT
Manage consent

Privacy Overview

This website uses cookies to improve your experience while you navigate through the website. Out of these, the cookies that are categorized as necessary are stored on your browser as they are essential for the working of basic functionalities of the website. We also use third-party cookies that help us analyze and understand how you use this website. These cookies will be stored in your browser only with your consent. You also have the option to opt-out of these cookies. But opting out of some of these cookies may affect your browsing experience.
Necessary
Always Enabled
Necessary cookies are absolutely essential for the website to function properly. This category only includes cookies that ensures basic functionalities and security features of the website. These cookies do not store any personal information.
Non-necessary
Any cookies that may not be particularly necessary for the website to function and is used specifically to collect user personal data via analytics, ads, other embedded contents are termed as non-necessary cookies. It is mandatory to procure user consent prior to running these cookies on your website.
SAVE & ACCEPT