Skip to content
Global-Maritime-Hub- Logo
X-twitter Linkedin Youtube
  • Home
  • Premium Content
  • Insights
  • Events
  • Industry Links
    • Broker
    • Certification
    • Consultant
    • Industry Association
    • Institute & Think Tank
    • Legal Experts
    • Official Institution / Body
    • Port & Port Authority
    • Recruitment Specialist
    • Research & Market Data
    • Shipping Company
    • Industry Blog
    • Trade Media
    • Training & Education
  • About Us
  • Other Hubs
    • GLOBAL LNG HUB
    • EUROPEAN GAS HUB
    • THE COAL HUB
    • GLOBAL HYDROGEN HUB
    • GLOBAL MINERALS HUB
  • FREE TRIAL
  • My account
  • Login
  • Home
  • Premium Content
  • Insights
  • Events
  • Industry Links
    • Broker
    • Certification
    • Consultant
    • Industry Association
    • Institute & Think Tank
    • Legal Experts
    • Official Institution / Body
    • Port & Port Authority
    • Recruitment Specialist
    • Research & Market Data
    • Shipping Company
    • Industry Blog
    • Trade Media
    • Training & Education
  • About Us
  • Other Hubs
    • GLOBAL LNG HUB
    • EUROPEAN GAS HUB
    • THE COAL HUB
    • GLOBAL HYDROGEN HUB
    • GLOBAL MINERALS HUB
  • FREE TRIAL
  • My account
  • Login
€0.00 0 Cart
Global-Maritime-Hub- Logo
€0.00 0 Cart
  • Home
  • Premium Content
  • Insights
  • Events
  • Industry Links
    • Broker
    • Certification
    • Consultant
    • Industry Association
    • Institute & Think Tank
    • Legal Experts
    • Official Institution / Body
    • Port & Port Authority
    • Recruitment Specialist
    • Research & Market Data
    • Shipping Company
    • Industry Blog
    • Trade Media
    • Training & Education
  • About Us
  • Other Hubs
    • GLOBAL LNG HUB
    • EUROPEAN GAS HUB
    • THE COAL HUB
    • GLOBAL HYDROGEN HUB
    • GLOBAL MINERALS HUB
  • FREE TRIAL
  • My account
  • Login
X-twitter Linkedin Youtube

© 2025 GlobalMaritimeHub | All Rights Reserved

Tag: Maritime Trade

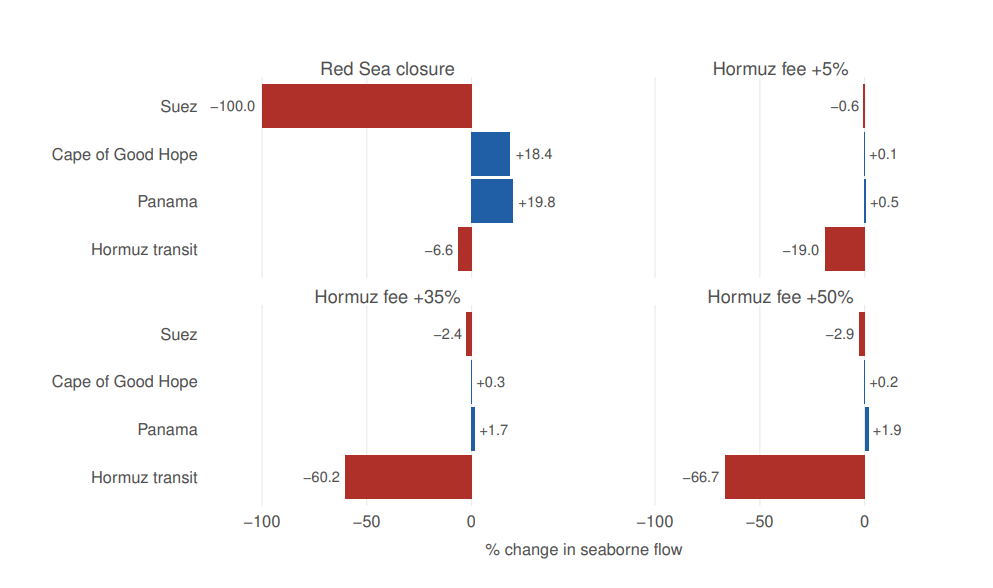
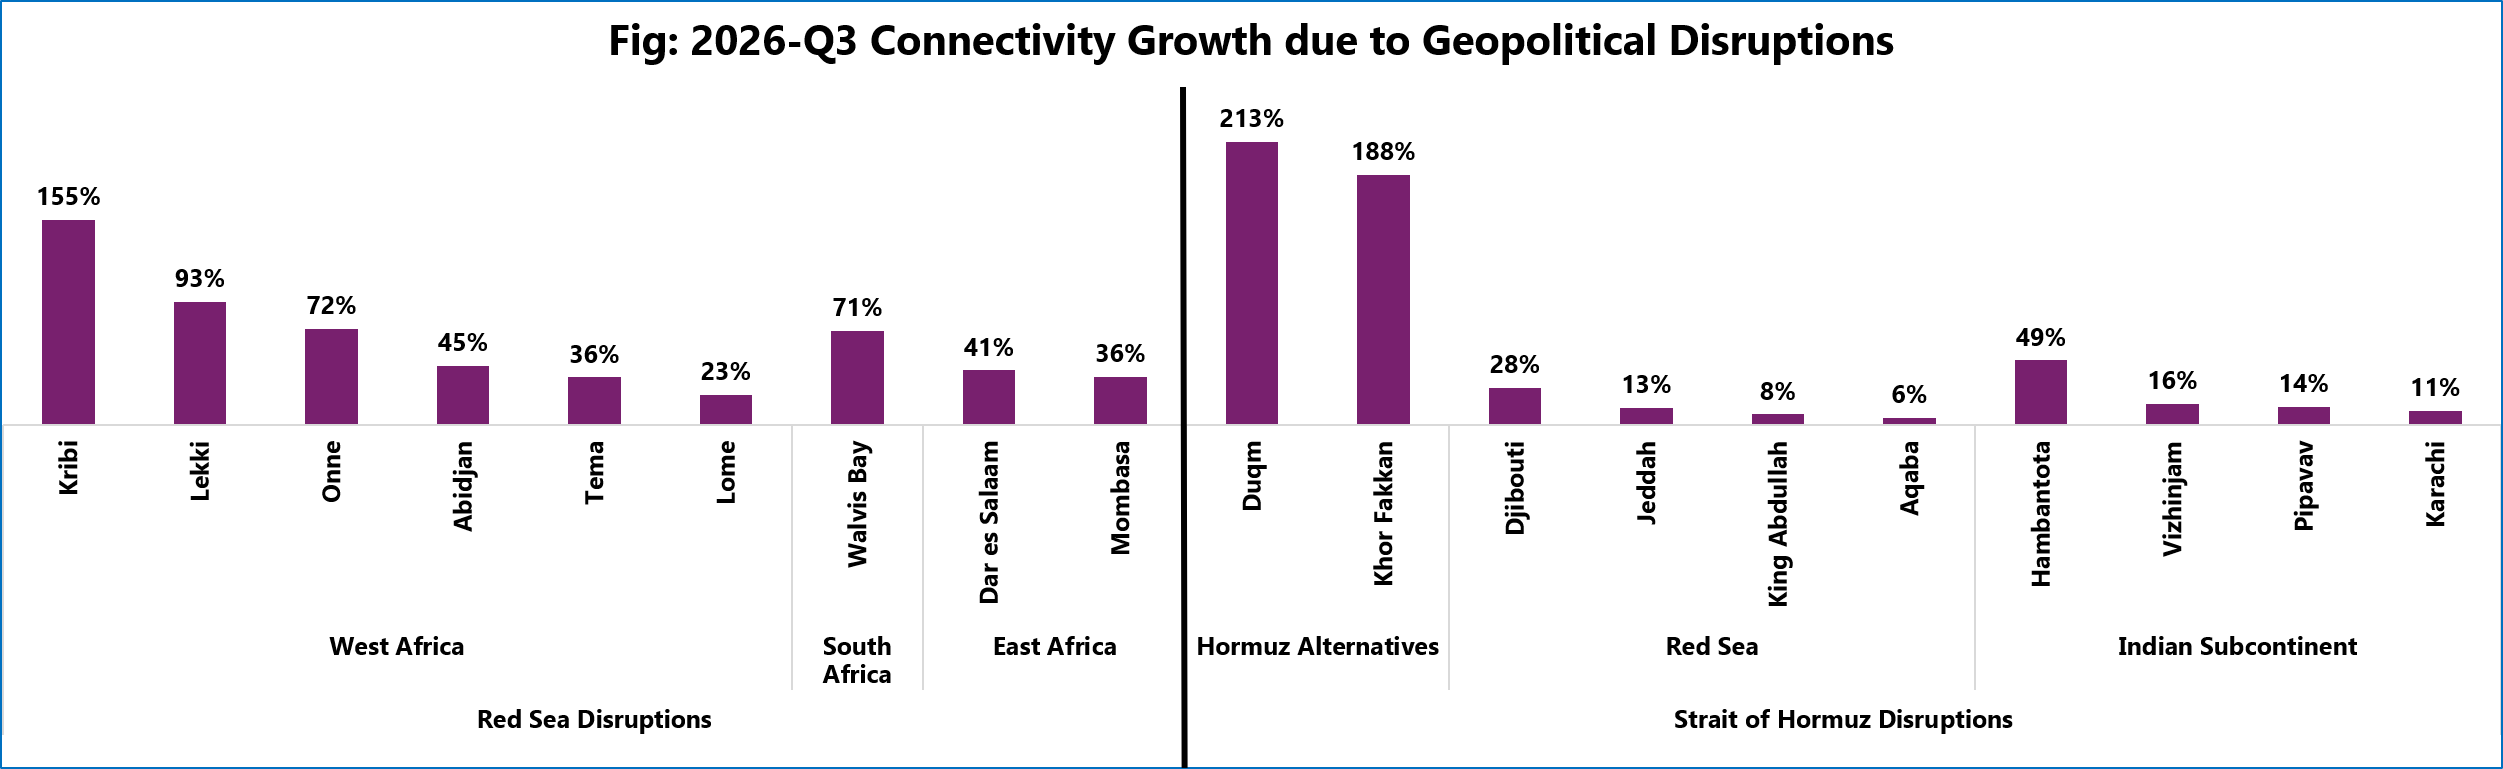
Maritime chokepoints showing changes in seaborne flows after Red Sea closure and higher Hormuz fees

Maritime chokepoints and the ripple effects of shipping route closures

  • August 20, 2026
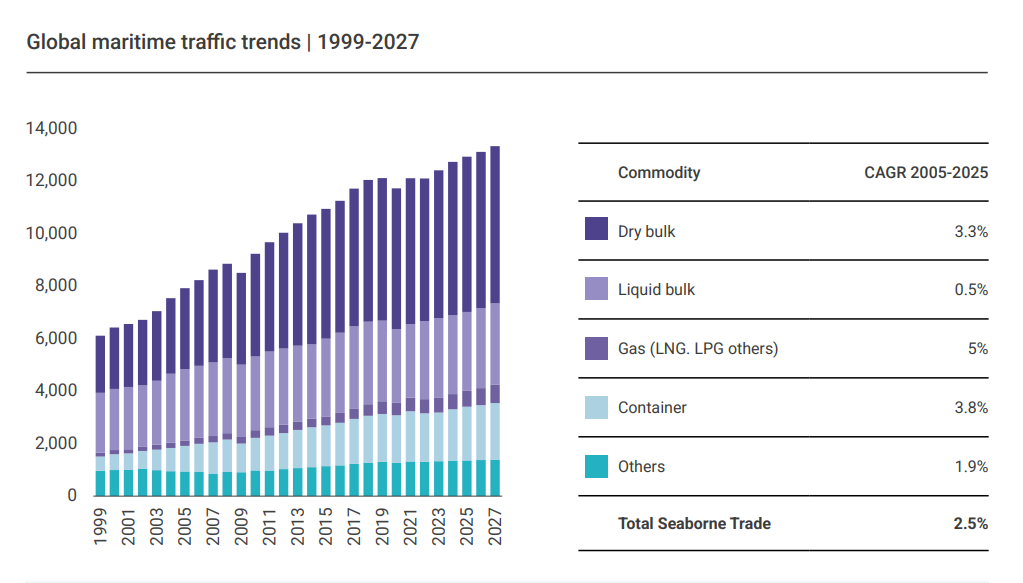
Mediterranean shipping shaped by changing global maritime traffic and trade routes from 1999 to 2027

Mediterranean shipping in a new era of chokepoints and changing trade routes

  • August 20, 2026
U.S. container imports by country of origin, July 2026

U.S. container imports rise as trade uncertainty persists

  • August 14, 2026
Stacked bar chart of Port of Gdańsk cargo throughput, 2015–2024, in million tonnes. Each year is broken down by fuels (dark purple), general cargo (blue), coal (light blue), bulk (teal), grain (green), ore (mid blue), and timber (green). Overall throughput increases from about 34–35 million tonnes in 2015 to around 90 million tonnes by 2024, with fuels and general cargo as the largest components and steady year‑to‑year growth.

Economic impact of ports demonstrated by Port of Gdańsk’s growing role

  • August 6, 2026
China shipbuilding exposure in maritime exports to the U.S. by country

China shipbuilding dominance creates new risks for global maritime trade

  • July 24, 2026
Satellite view of maritime chokepoints and shipping traffic through the Strait of Hormuz

Maritime chokepoints face growing disruption risks from geopolitical conflict

  • July 24, 2026
Global trade outlook chart showing revised commodity price assumptions for 2026

Global trade outlook points to slower trade growth in 2026

  • July 17, 2026
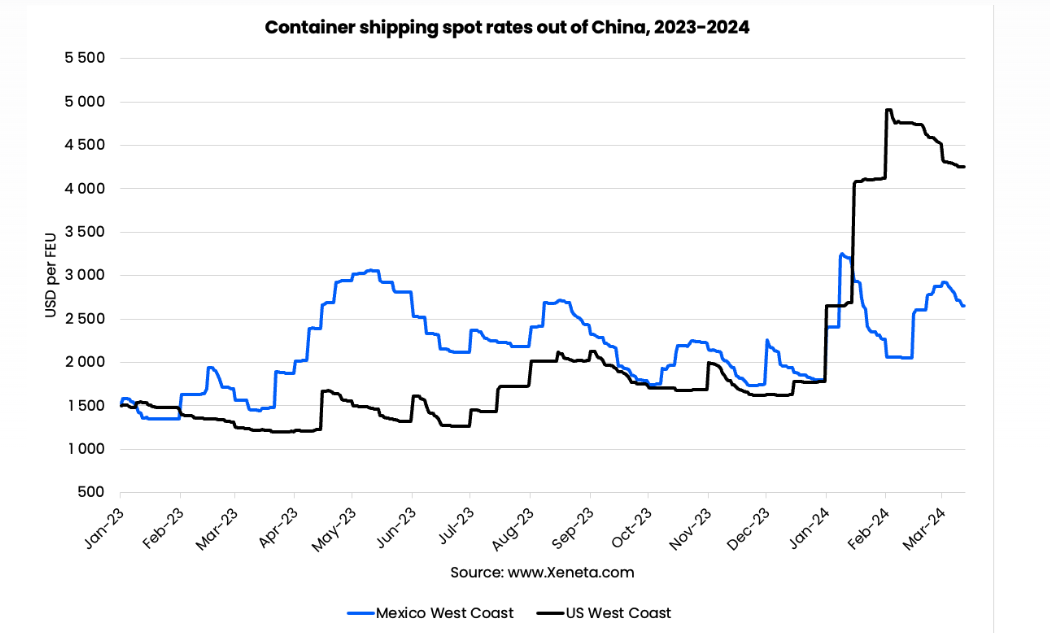
Shipping safety and freight rate volatility across major international container shipping routes

Shipping safety improves but geopolitical risks redefine maritime trade

  • June 26, 2026
U.S. container ports total TEUs and year-over-year change from 2015 to 2025

U.S. container ports navigate a changing trade landscape

  • June 4, 2026
Horizontal bar chart comparing 2016 (blue) and 2023 (yellow) normalized degree centrality for the world's top 10 ports, showing Zhoushan highest, followed by Shanghai and Hong Kong; Canada section appears below with top 5 ports such as Vancouver, Halifax, Montréal, New Westminster, and St John's.

Canadian ports lose ground in global shipping networks

  • May 28, 2026
Previous Page1 Page2 Page3 Page4 Next
Recent Post
Gatun Lake water levels and projected decline during El Niño

How El Niño is reshaping maritime trade and supply chains

September 4, 2026
July 2026 Asia schedule reliability showing sharp declines across major Asian container ports

Asian port congestion drives sharp drop in schedule reliability

September 3, 2026
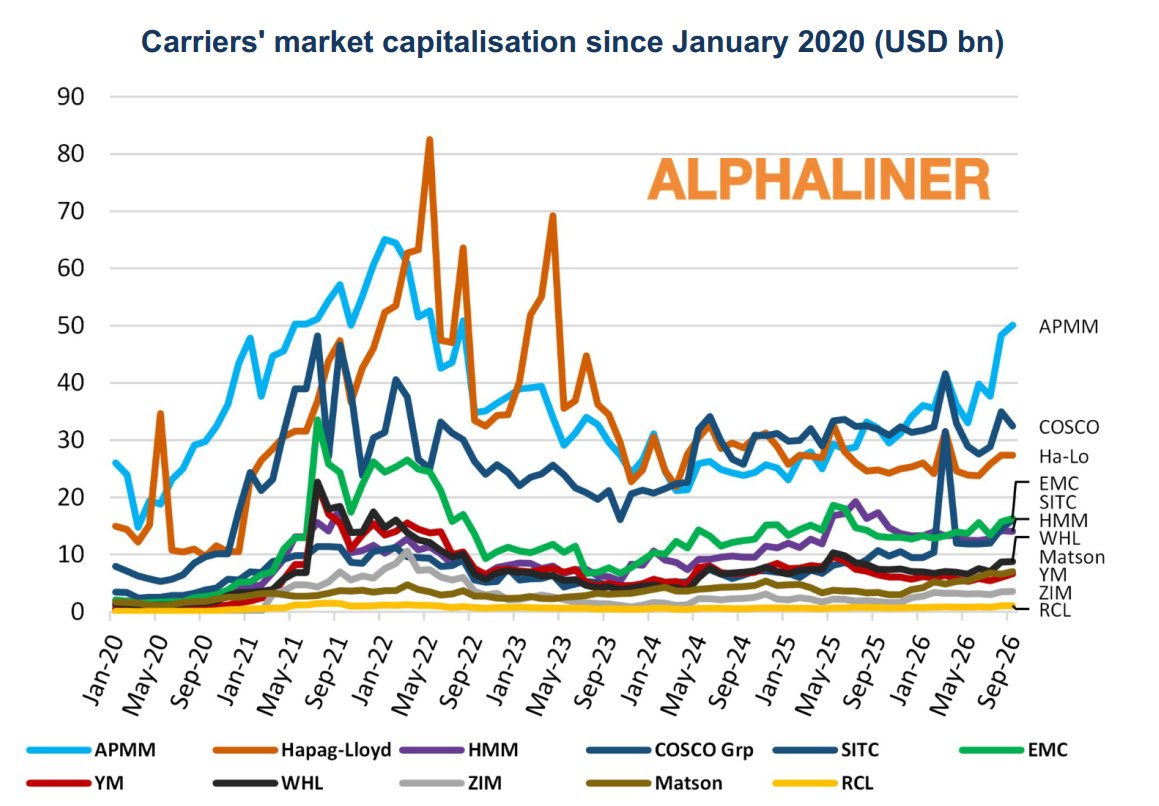
Chart titled 'Main carriers: Average core EBIT margin by quarter' showing a time series of quarterly EBIT margins from 1Q2013 to 2Q2026 for major carriers; includes a large 'ALPHALINER' watermark across the middle. (Informative: describes data range and purpose.)

Carrier profitability rebounds as freight rates and trade mix boost margins

September 3, 2026
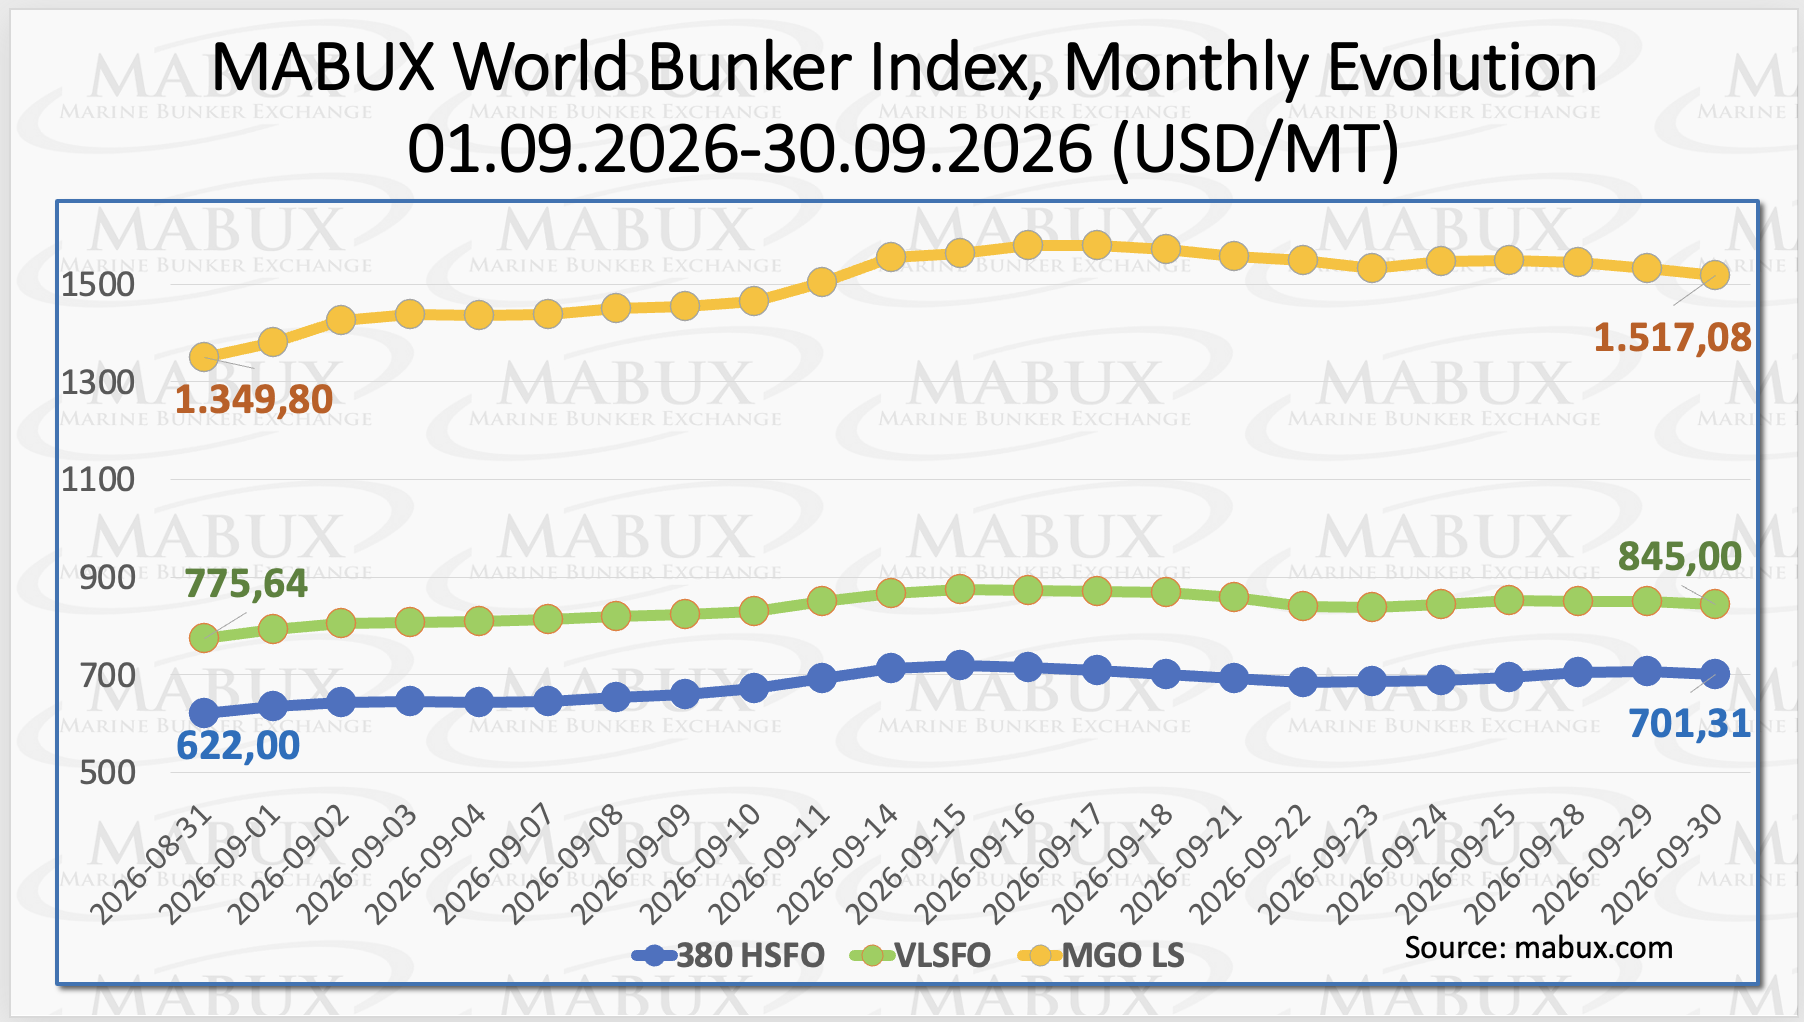
MABUX bunker fuel price index showing monthly changes in global bunker prices

Global bunker prices ease in August despite Middle East volatility

September 1, 2026
Trending Posts
leading-ports

Main container ports benefit from home carriers and dedicated terminals

December 27, 2023
Top 10 container ship operators by fleet capacity and market share infographic showing MSC, Maersk, CMA CGM, COSCO and others.

MSC fleet capacity surpasses 7.2 Mteu milestone

February 19, 2026
Container-Price-Sentiment-Index-xCPSI

China container prices: significant imbalance between supply and demand expectations

March 21, 2024
Bunker prices

Bunker Prices Outlook, Week 14

April 8, 2021
Global-Maritime-Hub- Logo

Maritime market intelligence platform featuring 2,200+ reports, presentations and industry insights, with new content added every week. more info

Categories

  • Shipping Economic Trends & Regions
  • Ports & Terminals
  • Piracy & Security
  • Emissions, Fuel Technology & Environment
  • Economic Impact
  • Financing
  • Ship Building
  • Hinterland & Intermodal
  • Port Environmental Impact
  • Shipping Workforce

Recent Analysis

How El Niño is reshaping maritime trade and supply chains

Asian port congestion drives sharp drop in schedule reliability

Carrier profitability rebounds as freight rates and trade mix boost margins

Weekly Updates

Sign up to receive our weekly newsletter (each Thursday) with new shipping industry market reports, presentations & analysis.

Your subscription could not be saved. Please try again.
Your subscription has been successful.

By signing up, I agree to our TOS and Privacy Policy.

© 2026 GlobalMaritimeHub | All Rights Reserved

X-twitter Linkedin Youtube