Skip to content
Global-Maritime-Hub- Logo
X-twitter Linkedin Youtube
  • Home
  • Premium Content
  • Insights
  • Events
  • Industry Links
    • Broker
    • Certification
    • Consultant
    • Industry Association
    • Institute & Think Tank
    • Legal Experts
    • Official Institution / Body
    • Port & Port Authority
    • Recruitment Specialist
    • Research & Market Data
    • Shipping Company
    • Industry Blog
    • Trade Media
    • Training & Education
  • About Us
  • Other Hubs
    • GLOBAL LNG HUB
    • EUROPEAN GAS HUB
    • THE COAL HUB
    • GLOBAL HYDROGEN HUB
    • GLOBAL MINERALS HUB
  • FREE TRIAL
  • My account
  • Login
  • Home
  • Premium Content
  • Insights
  • Events
  • Industry Links
    • Broker
    • Certification
    • Consultant
    • Industry Association
    • Institute & Think Tank
    • Legal Experts
    • Official Institution / Body
    • Port & Port Authority
    • Recruitment Specialist
    • Research & Market Data
    • Shipping Company
    • Industry Blog
    • Trade Media
    • Training & Education
  • About Us
  • Other Hubs
    • GLOBAL LNG HUB
    • EUROPEAN GAS HUB
    • THE COAL HUB
    • GLOBAL HYDROGEN HUB
    • GLOBAL MINERALS HUB
  • FREE TRIAL
  • My account
  • Login
€0.00 0 Cart
Global-Maritime-Hub- Logo
€0.00 0 Cart
  • Home
  • Premium Content
  • Insights
  • Events
  • Industry Links
    • Broker
    • Certification
    • Consultant
    • Industry Association
    • Institute & Think Tank
    • Legal Experts
    • Official Institution / Body
    • Port & Port Authority
    • Recruitment Specialist
    • Research & Market Data
    • Shipping Company
    • Industry Blog
    • Trade Media
    • Training & Education
  • About Us
  • Other Hubs
    • GLOBAL LNG HUB
    • EUROPEAN GAS HUB
    • THE COAL HUB
    • GLOBAL HYDROGEN HUB
    • GLOBAL MINERALS HUB
  • FREE TRIAL
  • My account
  • Login
X-twitter Linkedin Youtube

© 2025 GlobalMaritimeHub | All Rights Reserved

Tag: IMO

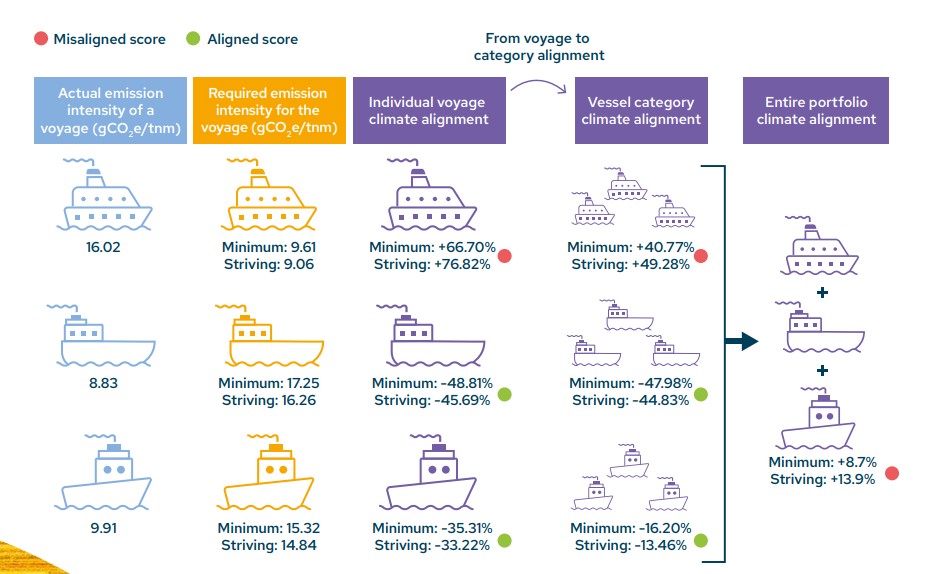
Shipping decarbonisation diagram showing voyage, vessel category and portfolio climate alignment scores

Shipping decarbonisation remains off track despite efficiency gains

  • June 18, 2026
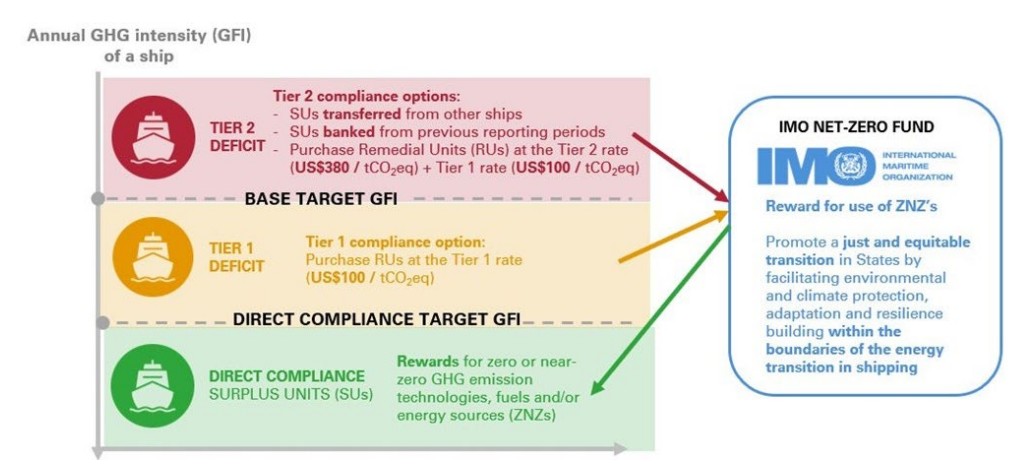
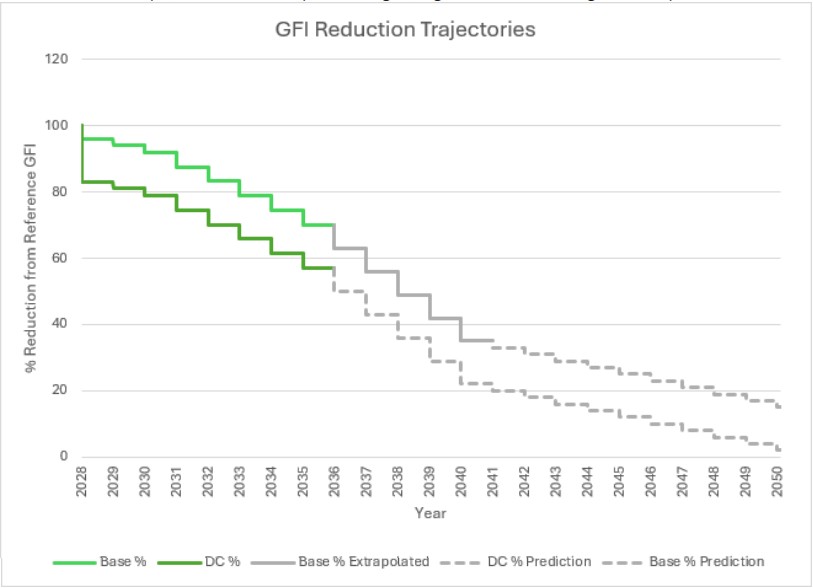
Maritime decarbonization diagram showing IMO net-zero framework, GHG fuel intensity targets and carbon pricing tiers

Maritime decarbonization stalls as IMO net-zero framework faces political deadlock

  • April 23, 2026
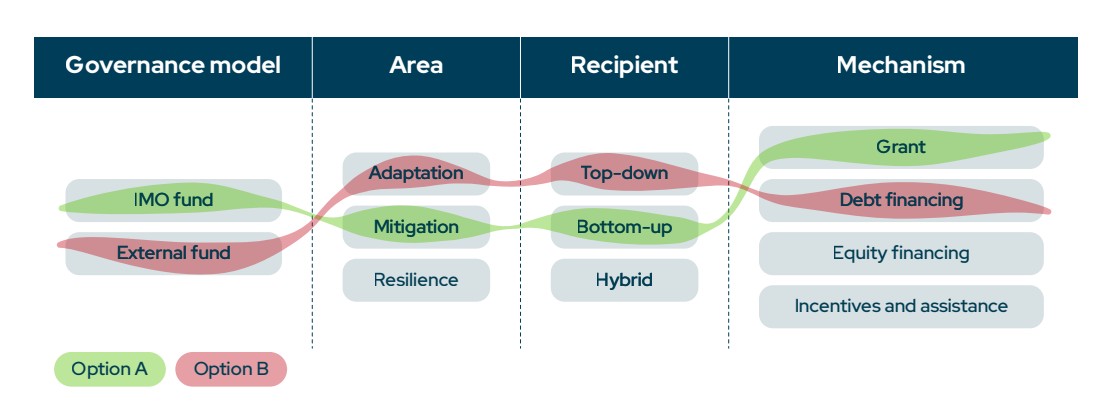
Shipping climate funds governance, recipient and financing options for a just and equitable transition

Shipping climate funds need flexible governance to deliver a just and equitable transition

  • March 19, 2026
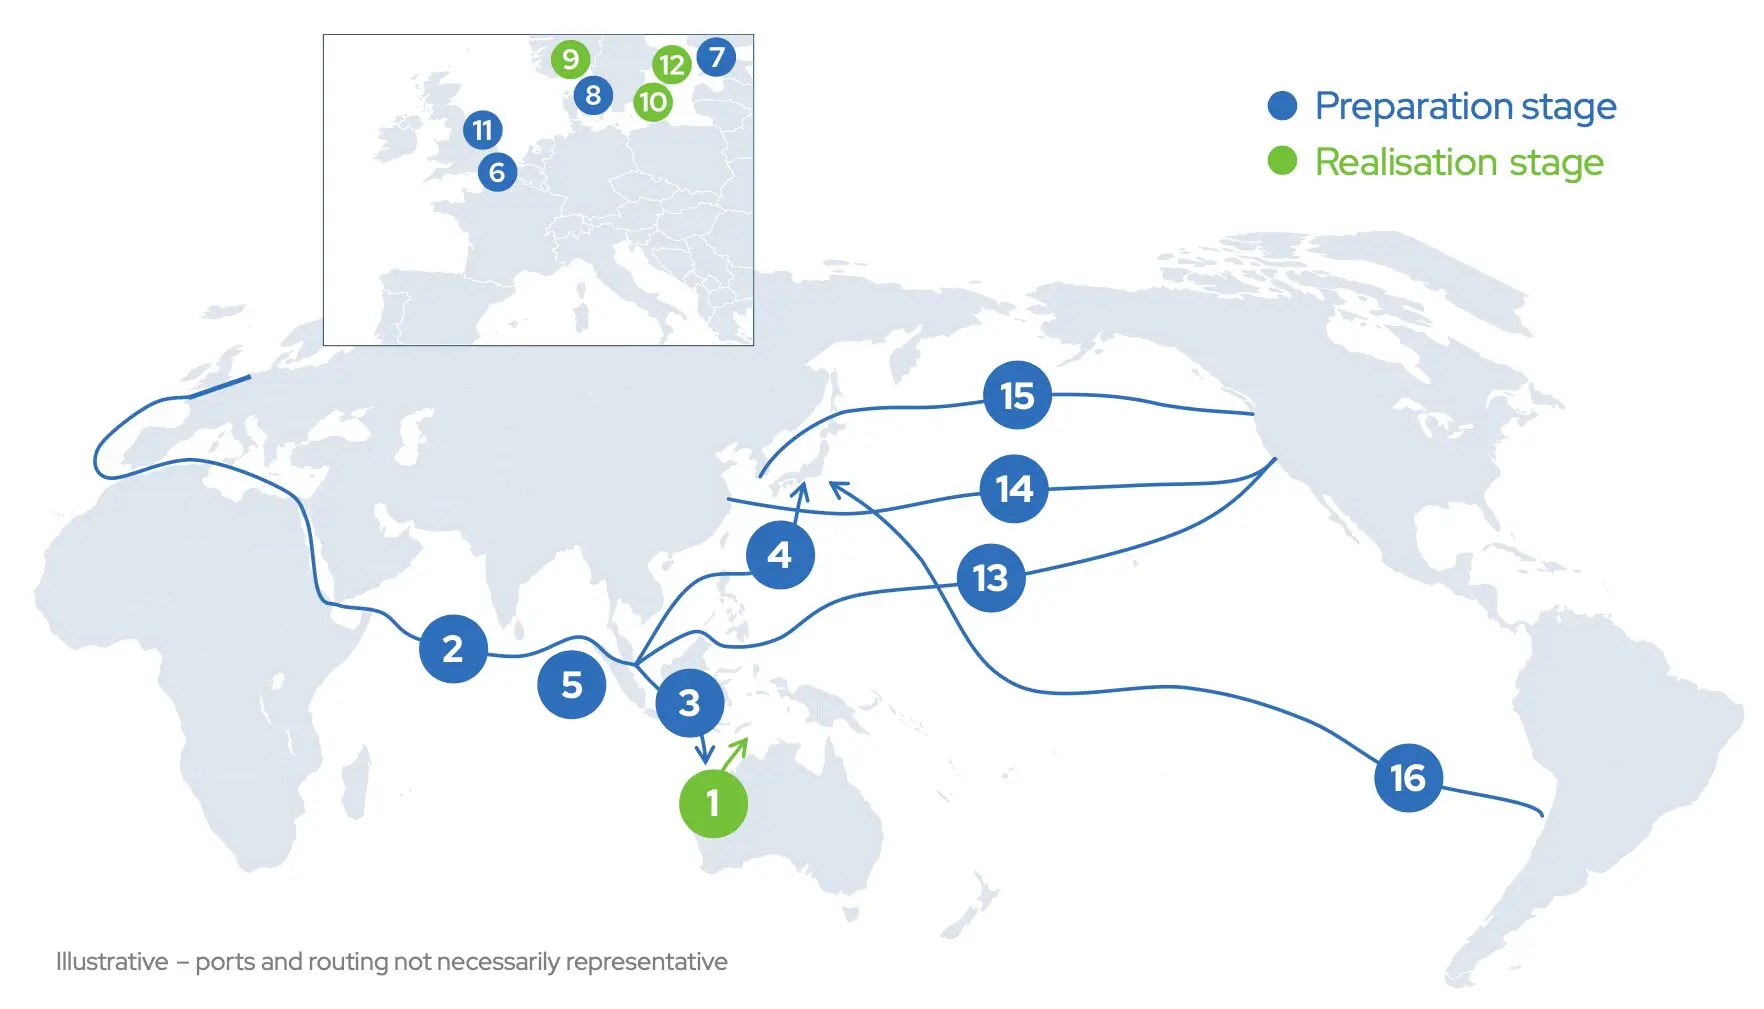
Progress of green corridors in 2025, showing routes in preparation and realisation stages.

Green corridors expand but progress stalls

  • November 28, 2025
Turkey-shipping

Turkey’s shipping sector expands 85% in 15 years as fleet value tops $22 billion

  • October 30, 2025
green-corridor-feasibility

South Africa–Europe green corridor could decarbonise iron ore shipping by 2035

  • October 30, 2025
Accelerating-to-Net-Zero

Setback for shipping decarbonization as IMO delays global GHG pricing decision

  • October 24, 2025
ETO

Decarbonising transport: why shipping’s transition still trails power and industry

  • October 17, 2025
changing-tides-strategic-implications-of-the-new-draft-imo-net-zero-framework-for-the-maritime-sector

IMO Net-Zero: shipping carbon levies, fuel rules, and freight costs

  • September 4, 2025
IMO

Future IMO and ILO legislation

  • May 29, 2025
Previous Page1 Page2 Page3 … Page6 Next
Recent Post
Asia-North Europe offered weekly TEU capacity during Golden Week 2026

Golden Week capacity surge raises October schedule risks

September 24, 2026
Alphaliner chart showing the percentage of fleet capacity chartered by the top-10 ocean carriers in 2026, including MSC, Maersk, CMA CGM, COSCO, Hapag-Lloyd, ONE, Evergreen, HMM, Yang Ming and ZIM.

Top-10 carriers reduce chartered tonnage exposure as owned fleets expand

September 24, 2026
Line chart of Red Sea share of Asia–Europe container capacity by direction and total; Europe→Asia (orange) peaks near 50% in early October while Asia→Europe (blue) fluctuates around 15–25%, and total Red Sea share (gray) stays ~18–30%.

Red Sea routing normalisation reaches 27% as Suez return builds

September 17, 2026
Chart comparing August 2026 and August 2025 deployed capacity for the top-20 Intra-Asia container carriers, with Maersk leading ahead of COSCO.

Maersk overtakes COSCO to lead the Intra-Asia shipping market

September 17, 2026
Trending Posts
impact of mega ships

Impact of Mega Boxship Deliveries on Asia-North Europe Trade

March 16, 2018
cargo-volume-growth

COSCO, Ha-Lo realise biggest volume gains in first six months

October 30, 2025

North American ports top the list for highest demurrage and detention charges

July 7, 2023
Far-East-India/Middle- East/Red-Sea-trade

COSCO Group leads Far East-India/Middle East/Red Sea trade

August 15, 2025
Global-Maritime-Hub- Logo

Maritime market intelligence platform featuring 2,200+ reports, presentations and industry insights, with new content added every week. more info

Categories

  • Shipping Economic Trends & Regions
  • Ports & Terminals
  • Piracy & Security
  • Emissions, Fuel Technology & Environment
  • Economic Impact
  • Financing
  • Ship Building
  • Hinterland & Intermodal
  • Port Environmental Impact
  • Shipping Workforce

Recent Analysis

Golden Week capacity surge raises October schedule risks

Top-10 carriers reduce chartered tonnage exposure as owned fleets expand

Red Sea routing normalisation reaches 27% as Suez return builds

Weekly Updates

Sign up to receive our weekly newsletter (each Thursday) with new shipping industry market reports, presentations & analysis.

Your subscription could not be saved. Please try again.
Your subscription has been successful.

By signing up, I agree to our TOS and Privacy Policy.

© 2026 GlobalMaritimeHub | All Rights Reserved

X-twitter Linkedin Youtube