Skip to content
Global-Maritime-Hub- Logo
X-twitter Linkedin Youtube
  • Home
  • Premium Content
  • Insights
  • Events
  • Industry Links
    • Broker
    • Certification
    • Consultant
    • Industry Association
    • Institute & Think Tank
    • Legal Experts
    • Official Institution / Body
    • Port & Port Authority
    • Recruitment Specialist
    • Research & Market Data
    • Shipping Company
    • Industry Blog
    • Trade Media
    • Training & Education
  • About Us
  • Other Hubs
    • GLOBAL LNG HUB
    • EUROPEAN GAS HUB
    • THE COAL HUB
    • GLOBAL HYDROGEN HUB
    • GLOBAL MINERALS HUB
  • FREE TRIAL
  • My account
  • Login
  • Home
  • Premium Content
  • Insights
  • Events
  • Industry Links
    • Broker
    • Certification
    • Consultant
    • Industry Association
    • Institute & Think Tank
    • Legal Experts
    • Official Institution / Body
    • Port & Port Authority
    • Recruitment Specialist
    • Research & Market Data
    • Shipping Company
    • Industry Blog
    • Trade Media
    • Training & Education
  • About Us
  • Other Hubs
    • GLOBAL LNG HUB
    • EUROPEAN GAS HUB
    • THE COAL HUB
    • GLOBAL HYDROGEN HUB
    • GLOBAL MINERALS HUB
  • FREE TRIAL
  • My account
  • Login
€0.00 0 Cart
Global-Maritime-Hub- Logo
€0.00 0 Cart
  • Home
  • Premium Content
  • Insights
  • Events
  • Industry Links
    • Broker
    • Certification
    • Consultant
    • Industry Association
    • Institute & Think Tank
    • Legal Experts
    • Official Institution / Body
    • Port & Port Authority
    • Recruitment Specialist
    • Research & Market Data
    • Shipping Company
    • Industry Blog
    • Trade Media
    • Training & Education
  • About Us
  • Other Hubs
    • GLOBAL LNG HUB
    • EUROPEAN GAS HUB
    • THE COAL HUB
    • GLOBAL HYDROGEN HUB
    • GLOBAL MINERALS HUB
  • FREE TRIAL
  • My account
  • Login
X-twitter Linkedin Youtube

© 2025 GlobalMaritimeHub | All Rights Reserved

Tag: maritime decarbonisation

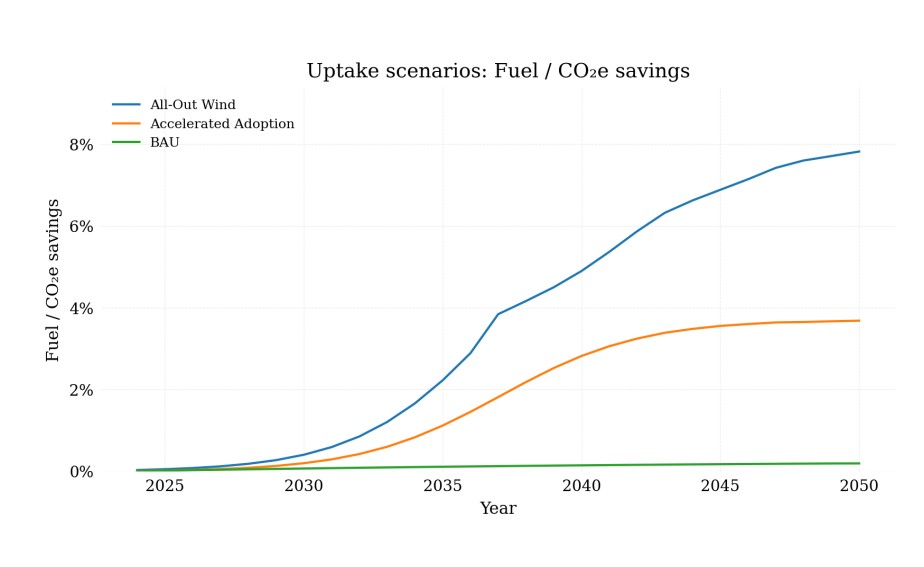
Line chart titled Uptake scenarios: Fuel / CO2e savings. Blue line (All-Out Wind) increases from near 0% in 2025 to about 8% by 2050; orange line (Accelerated Adoption) rises to around 4% by 2050; green line (BAU) stays near 0% throughout. X-axis shows years 2025–2050, Y-axis shows Fuel/CO2e savings from 0% to 8%.

Wind propulsion could cut global shipping emissions through targeted fleet adoption

  • April 30, 2026
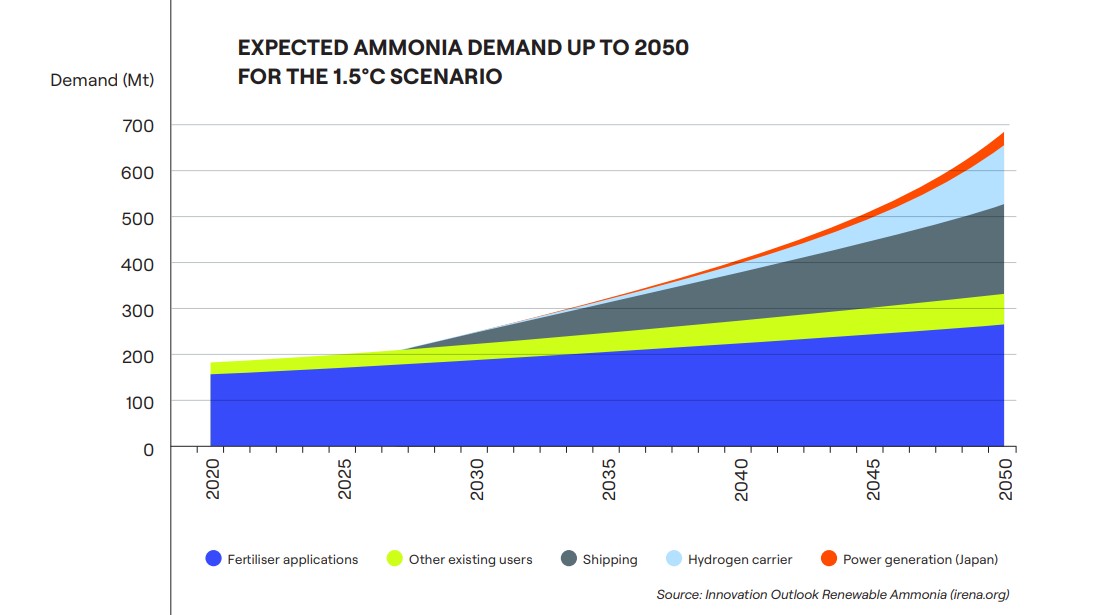
Blue ammonia demand forecast chart showing growth in shipping, hydrogen carrier and power generation to 2050

Blue ammonia gains traction as scalable low-carbon fuel for maritime and power

  • April 23, 2026
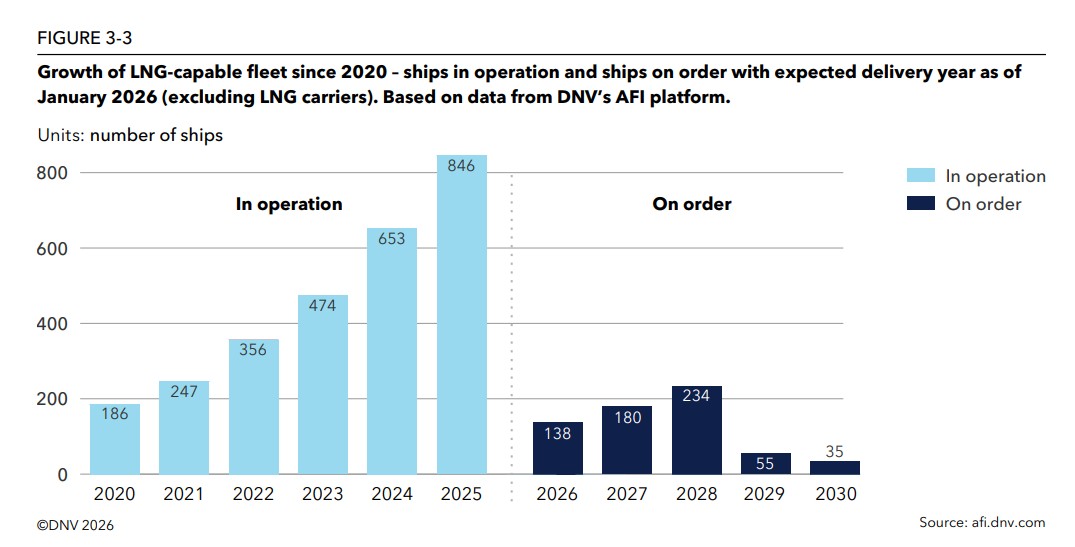
Graph showing rapid growth in LNG shipping vessels in operation and on order from 2020 to 2030

LNG shipping expands as methane debate shapes pathway to low-GHG fuels

  • April 16, 2026
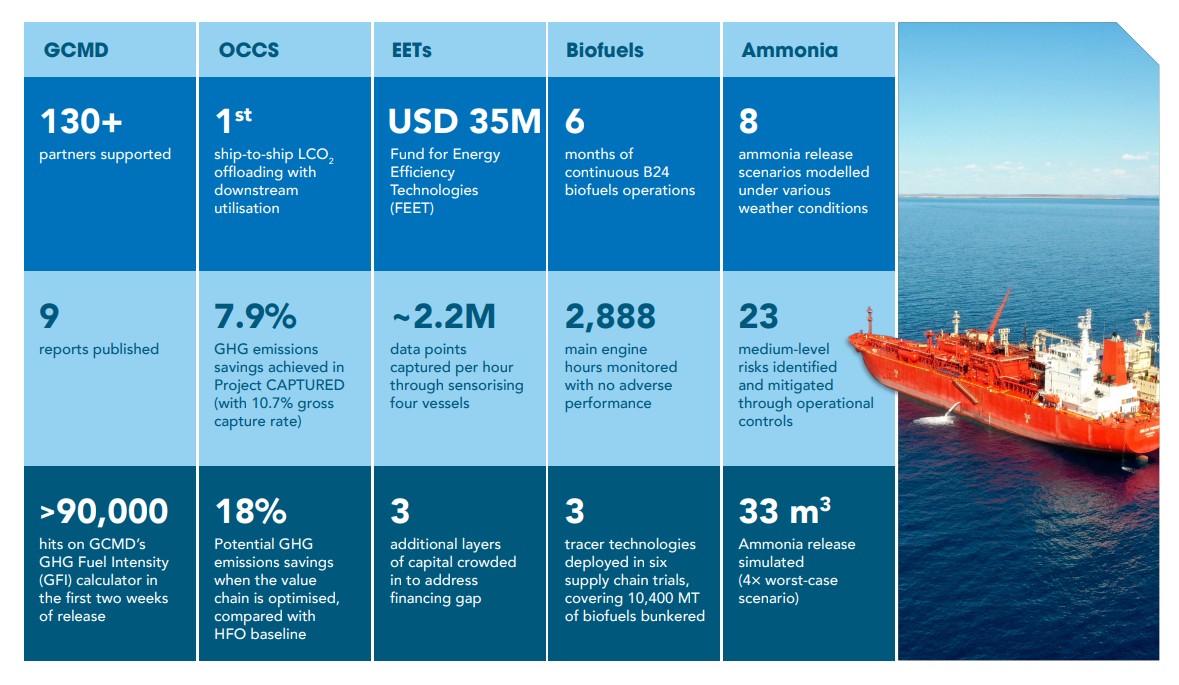
2025 maritime decarbonisation highlights showing carbon capture, biofuels, ammonia and vessel efficiency progress

Maritime decarbonisation advances through real-world trials, carbon capture and green fuel scale-up

  • April 16, 2026
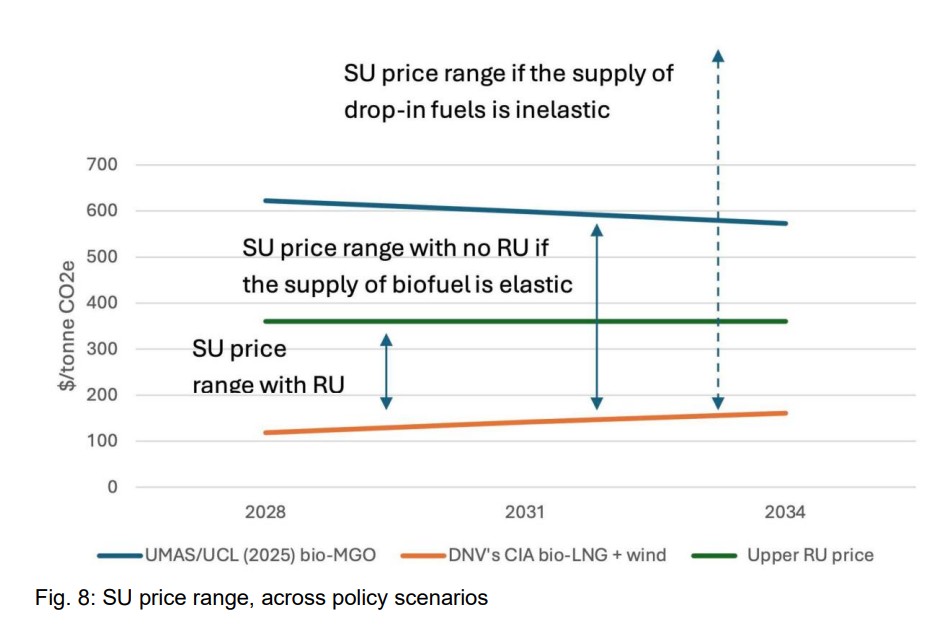
Chart showing SU price ranges across shipping policy scenarios and the impact of stable market design on clean-fuel investment

Shipping energy transition needs stable policy signals to unlock scalable clean-fuel investment

  • April 16, 2026
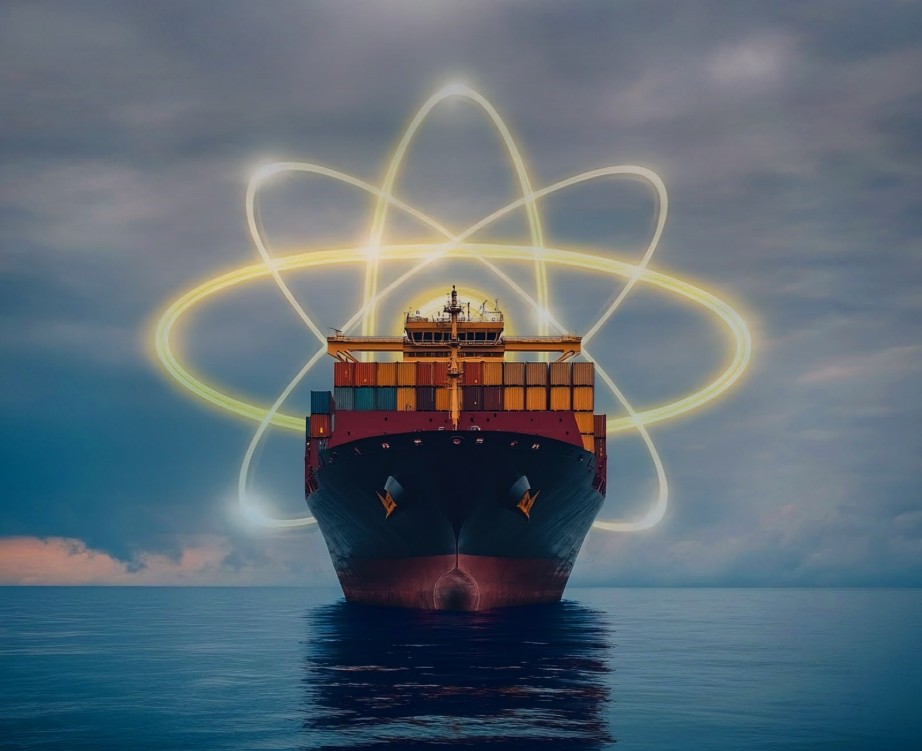
Container ship with an atomic symbol representing nuclear shipping and maritime decarbonisation

Nuclear shipping faces regulatory and safety hurdles

  • April 9, 2026
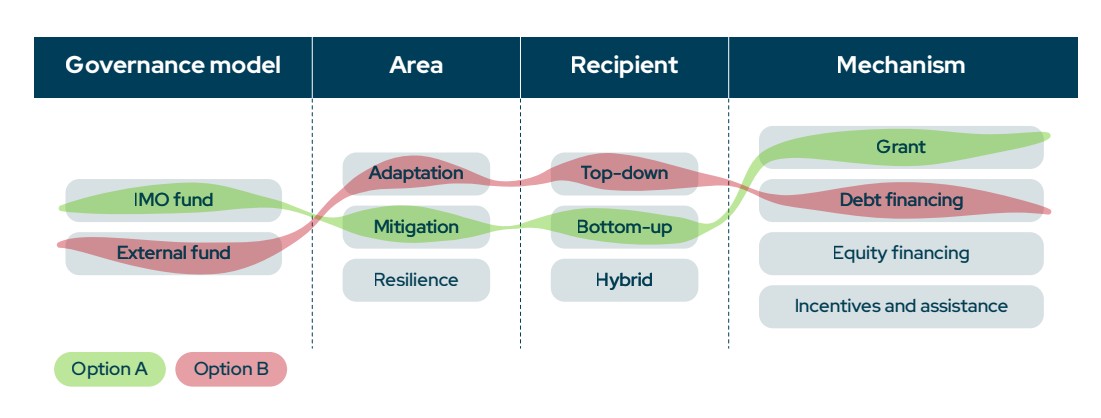
Shipping climate funds governance, recipient and financing options for a just and equitable transition

Shipping climate funds need flexible governance to deliver a just and equitable transition

  • March 19, 2026
Port of Long Beach aerial view in the Singapore Los Angeles Long Beach green shipping corridor report

Green shipping corridor shows how Singapore, Los Angeles and Long Beach are advancing maritime decarbonisation

  • March 19, 2026
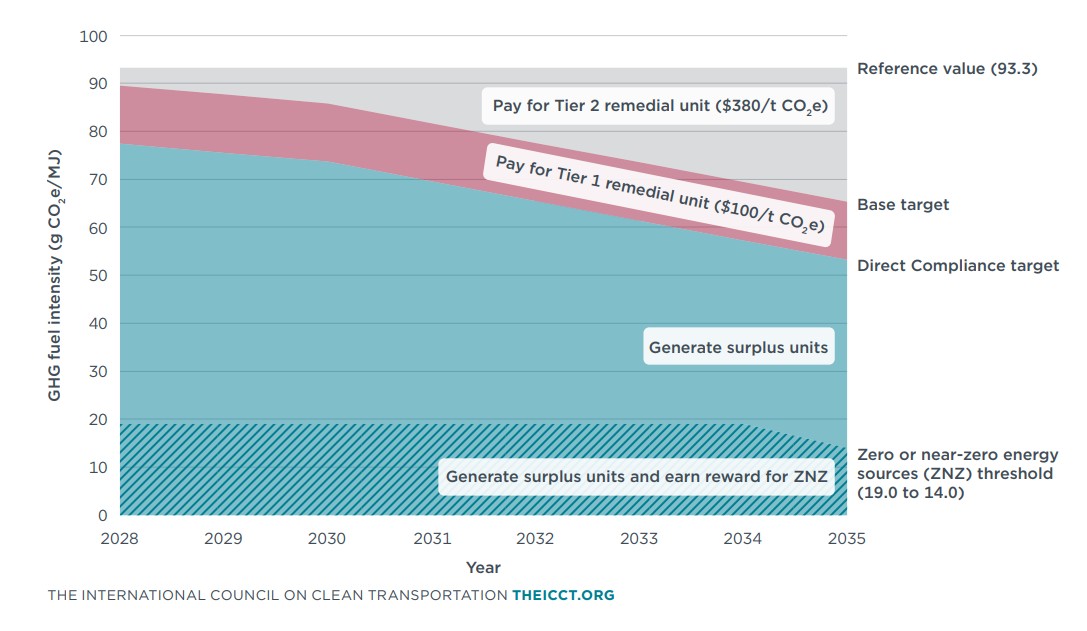
IMO net-zero framework targets and compliance structure for shipping emissions

IMO net-zero framework could generate $12 billion annually for maritime climate transition

  • March 12, 2026
Chart showing CO₂ abatement cost per ton for onboard carbon capture shipping across price scenarios

Onboard carbon capture gains momentum as decarbonisation pathway for shipping

  • February 26, 2026
Previous Page1 Page2 Page3 Page4 Page5 Next
Recent Post
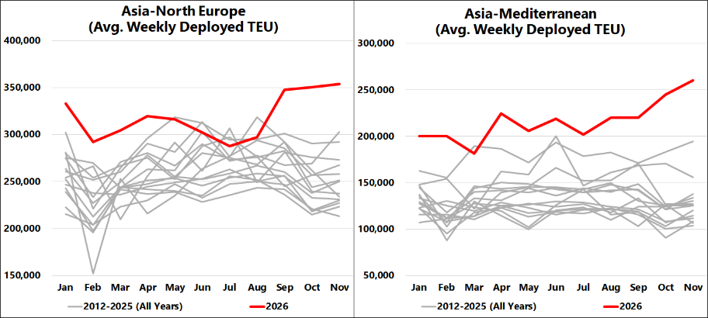
Average weekly deployed container capacity on Asia-North Europe and Asia-Mediterranean trade lanes in 2026

Asia-Europe container capacity reaches unprecedented levels

November 3, 2026
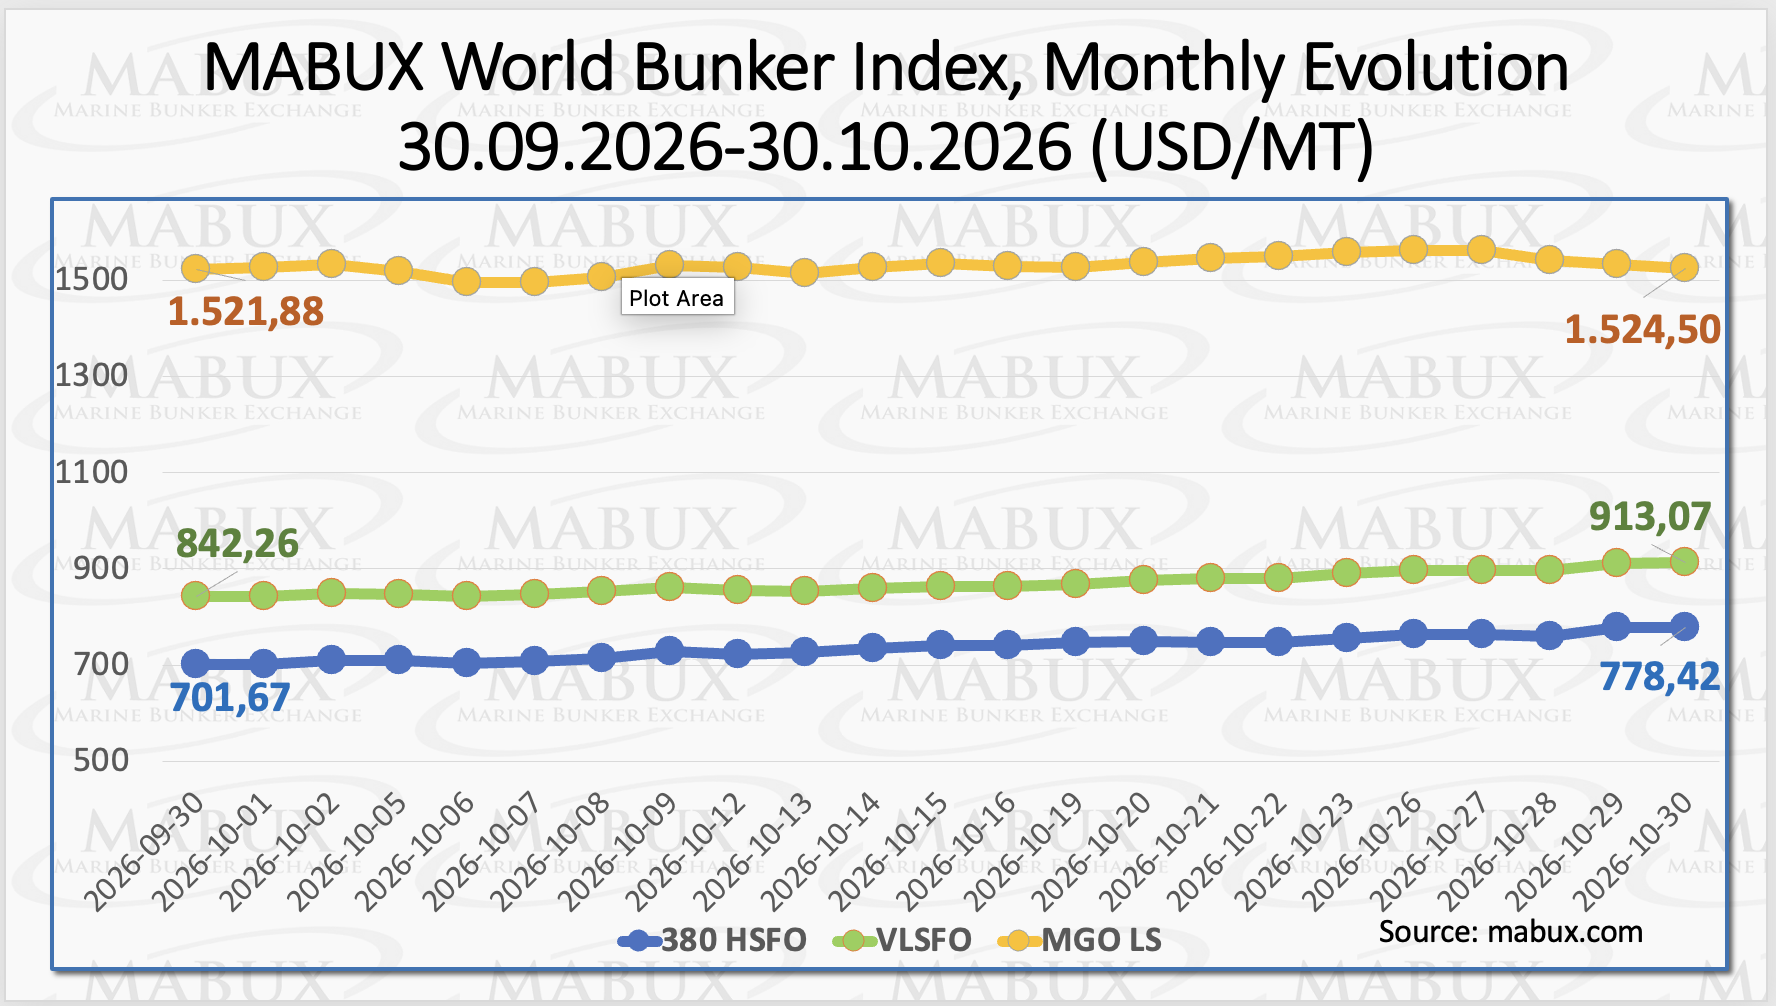
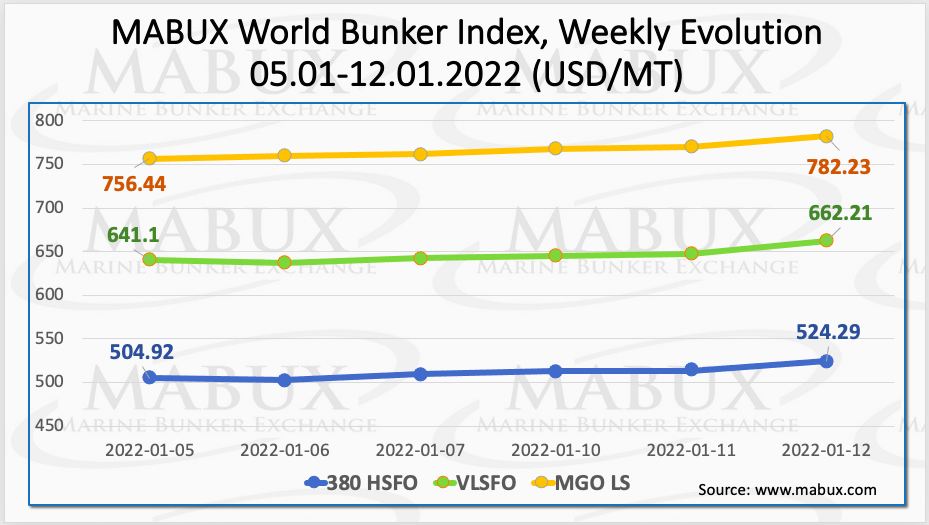
MABUX chart showing global bunker prices for HSFO, VLSFO and MGO LS in October 2026

Global bunker prices rise in October amid Middle East tensions and supply constraints

November 2, 2026
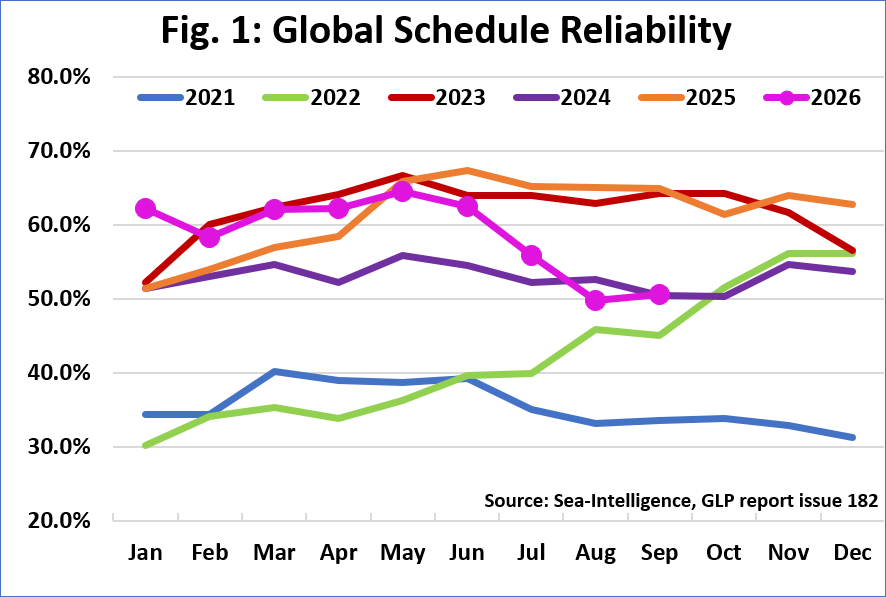
Global container shipping schedule reliability from 2021 to September 2026

Global schedule reliability edges higher in September 2026

October 29, 2026
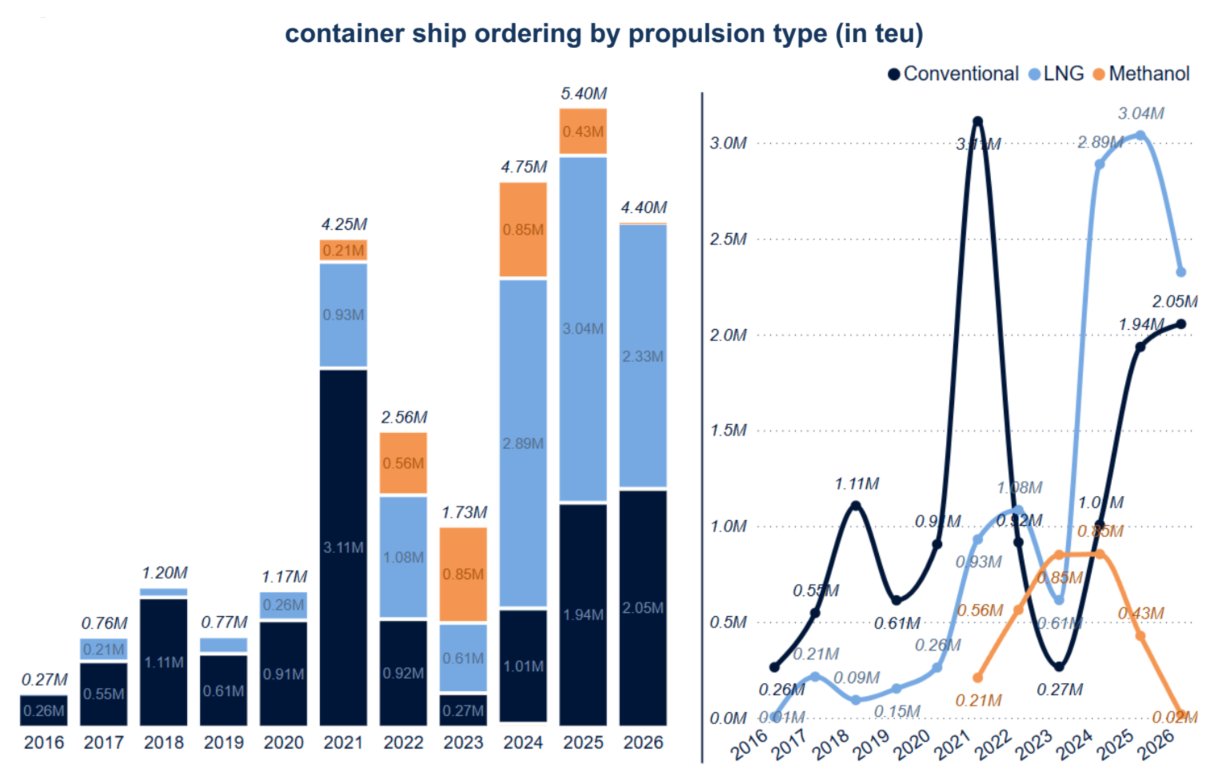
Alphaliner chart showing container ship ordering by propulsion type from 2016 to 2026, with LNG dual-fuel orders dominating recent newbuilding capacity.

Container ship orderbook tops 15 Mteu as LNG orders dominate newbuildings

October 29, 2026
Trending Posts
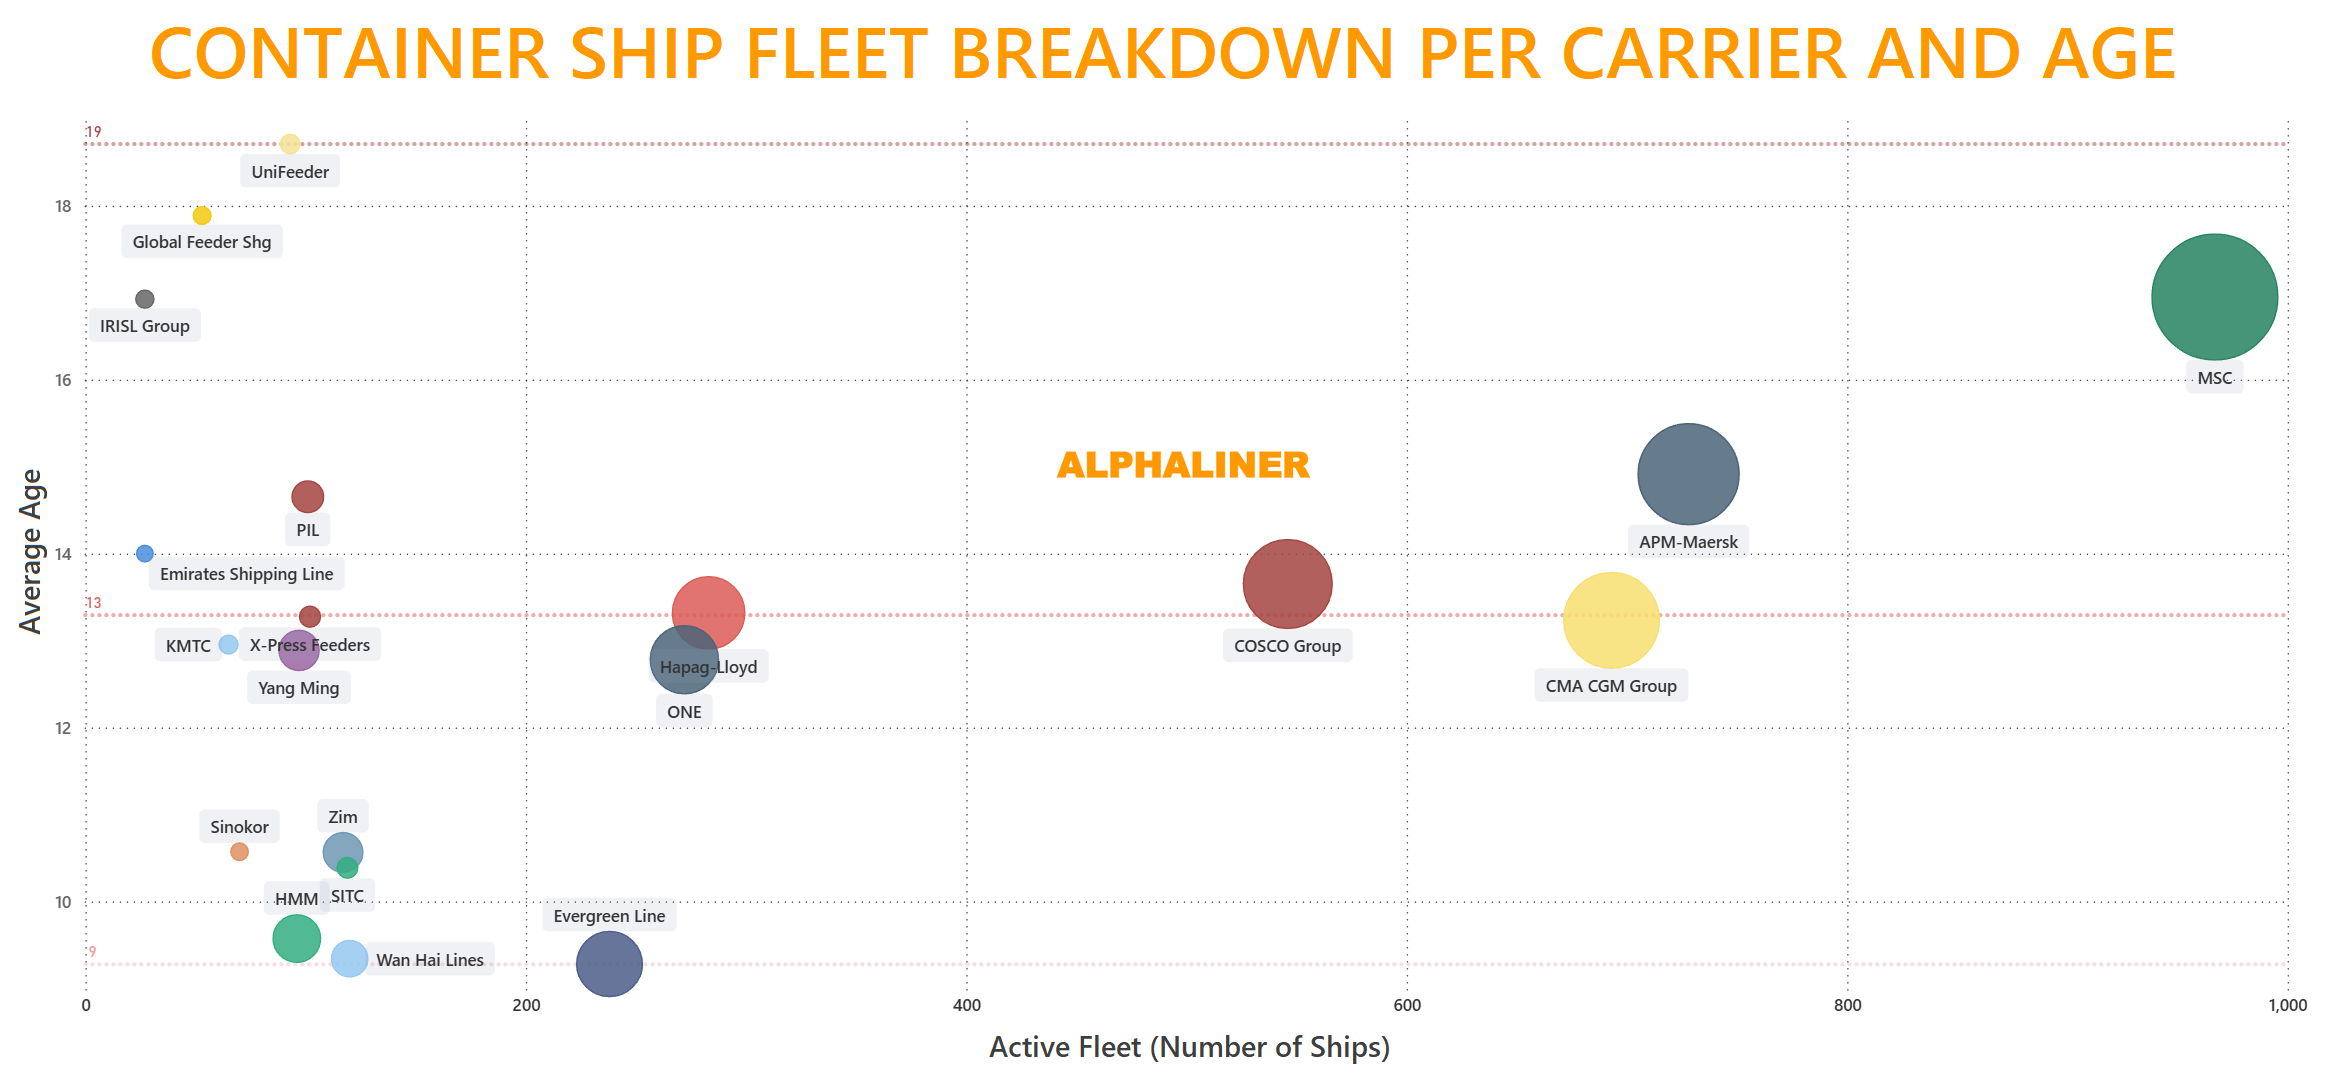
Bubble chart showing active container ship fleet size versus average vessel age for major global carriers.

Container fleet age ranking: Evergreen operates the youngest fleet among Top 20 carriers

February 26, 2026
LNG carriers

LNG Freight Rates Stabilise

July 2, 2020
Container xchange

Despite shortage, containers rotting in depots?

December 2, 2020

MABUX: Bunker Weekly Outlook, Week 02, 2022

January 13, 2022
Global-Maritime-Hub- Logo

Maritime market intelligence platform featuring 2,200+ reports, presentations and industry insights, with new content added every week. more info

Categories

  • Shipping Economic Trends & Regions
  • Ports & Terminals
  • Piracy & Security
  • Emissions, Fuel Technology & Environment
  • Economic Impact
  • Financing
  • Ship Building
  • Hinterland & Intermodal
  • Port Environmental Impact
  • Shipping Workforce

Recent Analysis

Asia-Europe container capacity reaches unprecedented levels

Global bunker prices rise in October amid Middle East tensions and supply constraints

Global schedule reliability edges higher in September 2026

Weekly Updates

Sign up to receive our weekly newsletter (each Thursday) with new shipping industry market reports, presentations & analysis.

Your subscription could not be saved. Please try again.
Your subscription has been successful.

By signing up, I agree to our TOS and Privacy Policy.

© 2026 GlobalMaritimeHub | All Rights Reserved

X-twitter Linkedin Youtube
Manage Consent
To provide the best experiences, we use technologies like cookies to store and/or access device information. Consenting to these technologies will allow us to process data such as browsing behavior or unique IDs on this site. Not consenting or withdrawing consent, may adversely affect certain features and functions.
Functional Always active
The technical storage or access is strictly necessary for the legitimate purpose of enabling the use of a specific service explicitly requested by the subscriber or user, or for the sole purpose of carrying out the transmission of a communication over an electronic communications network.
Preferences
The technical storage or access is necessary for the legitimate purpose of storing preferences that are not requested by the subscriber or user.
Statistics
The technical storage or access that is used exclusively for statistical purposes. The technical storage or access that is used exclusively for anonymous statistical purposes. Without a subpoena, voluntary compliance on the part of your Internet Service Provider, or additional records from a third party, information stored or retrieved for this purpose alone cannot usually be used to identify you.
Marketing
The technical storage or access is required to create user profiles to send advertising, or to track the user on a website or across several websites for similar marketing purposes.
  • Manage options
  • Manage services
  • Manage {vendor_count} vendors
  • Read more about these purposes
View preferences
  • {title}
  • {title}
  • {title}