Skip to content
Global-Maritime-Hub- Logo
X-twitter Linkedin Youtube
  • Home
  • Premium Content
  • Insights
  • Events
  • Industry Links
    • Broker
    • Certification
    • Consultant
    • Industry Association
    • Institute & Think Tank
    • Legal Experts
    • Official Institution / Body
    • Port & Port Authority
    • Recruitment Specialist
    • Research & Market Data
    • Shipping Company
    • Industry Blog
    • Trade Media
    • Training & Education
  • About Us
  • Other Hubs
    • GLOBAL LNG HUB
    • EUROPEAN GAS HUB
    • THE COAL HUB
    • GLOBAL HYDROGEN HUB
    • GLOBAL MINERALS HUB
  • FREE TRIAL
  • My account
  • Login
  • Home
  • Premium Content
  • Insights
  • Events
  • Industry Links
    • Broker
    • Certification
    • Consultant
    • Industry Association
    • Institute & Think Tank
    • Legal Experts
    • Official Institution / Body
    • Port & Port Authority
    • Recruitment Specialist
    • Research & Market Data
    • Shipping Company
    • Industry Blog
    • Trade Media
    • Training & Education
  • About Us
  • Other Hubs
    • GLOBAL LNG HUB
    • EUROPEAN GAS HUB
    • THE COAL HUB
    • GLOBAL HYDROGEN HUB
    • GLOBAL MINERALS HUB
  • FREE TRIAL
  • My account
  • Login
€0.00 0 Cart
Global-Maritime-Hub- Logo
€0.00 0 Cart
  • Home
  • Premium Content
  • Insights
  • Events
  • Industry Links
    • Broker
    • Certification
    • Consultant
    • Industry Association
    • Institute & Think Tank
    • Legal Experts
    • Official Institution / Body
    • Port & Port Authority
    • Recruitment Specialist
    • Research & Market Data
    • Shipping Company
    • Industry Blog
    • Trade Media
    • Training & Education
  • About Us
  • Other Hubs
    • GLOBAL LNG HUB
    • EUROPEAN GAS HUB
    • THE COAL HUB
    • GLOBAL HYDROGEN HUB
    • GLOBAL MINERALS HUB
  • FREE TRIAL
  • My account
  • Login
X-twitter Linkedin Youtube

© 2025 GlobalMaritimeHub | All Rights Reserved

Tag: maritime decarbonisation

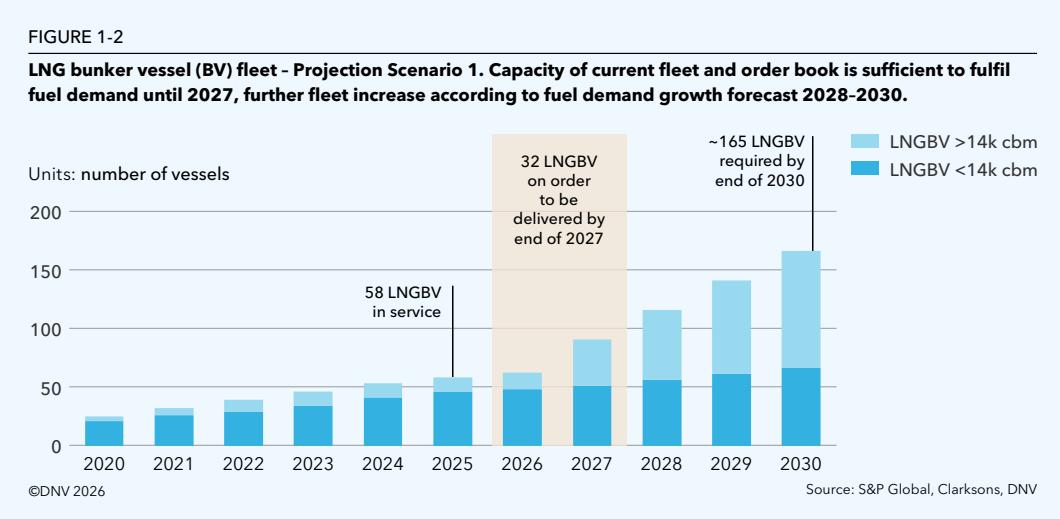
LNG bunker vessel fleet projected to increase from 58 vessels to approximately 165 by 2030

LNG bunker vessels may need to more than triple by 2030

  • September 18, 2026
Carbon dioxide temperature and pressure diagram relevant to onboard carbon capture in shipping

Onboard carbon capture could bridge shipping’s fuel transition

  • September 11, 2026
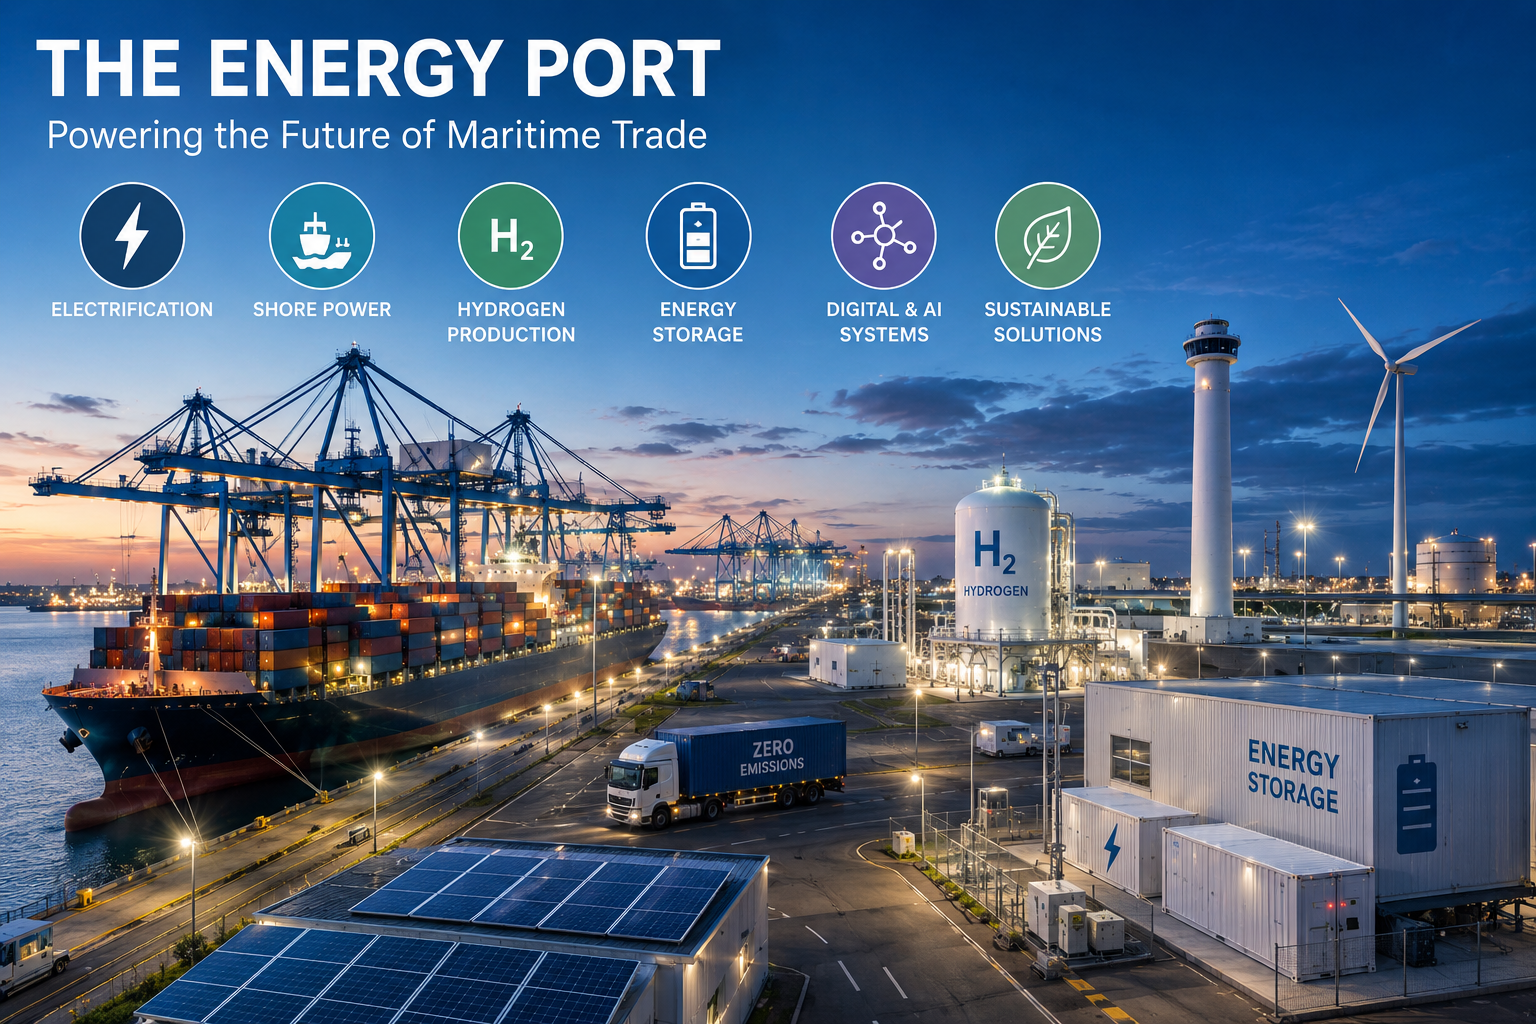
Energy ports integrating electrification, shore power, hydrogen, energy storage and sustainable maritime systems

Energy ports move from concept towards strategic planning

  • August 20, 2026
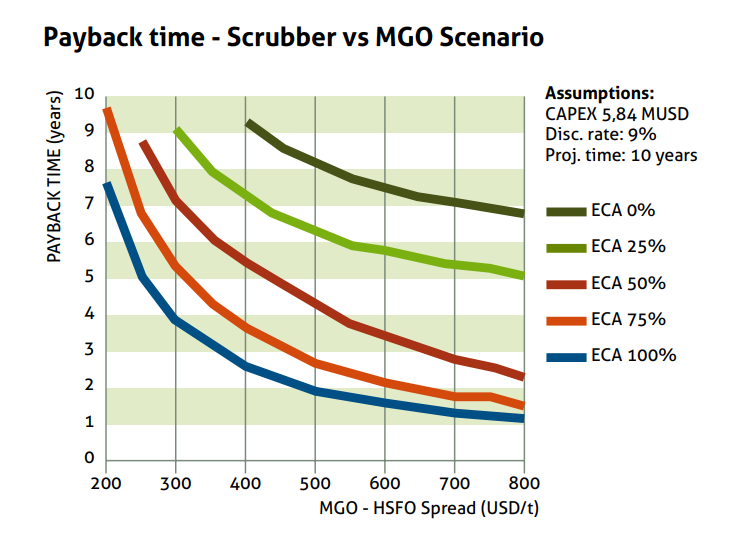
Ship emissions scrubber payback compared with MGO across different ECA operating levels

Ship emissions and the economics of ECA compliance

  • August 14, 2026
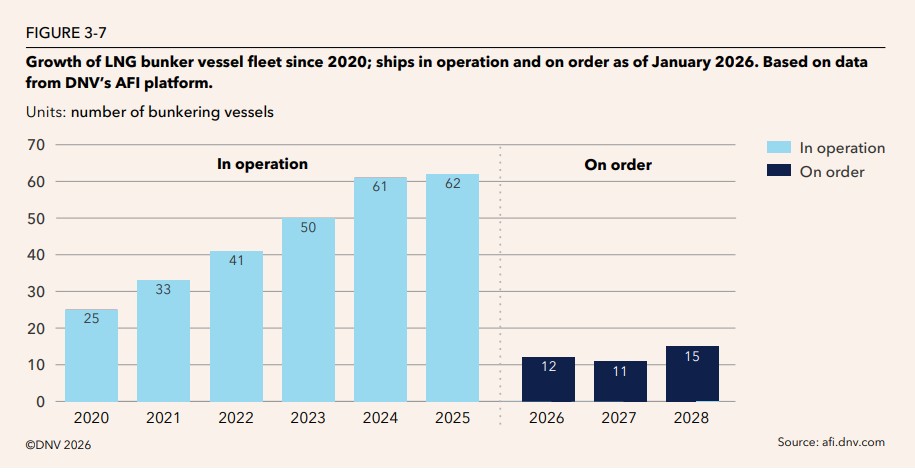
LNG bunker vessel fleet growth showing ships in operation and on order from 2020 to 2028

LNG-fuelled ships face a growing need for bio-LNG and e-LNG

  • June 25, 2026
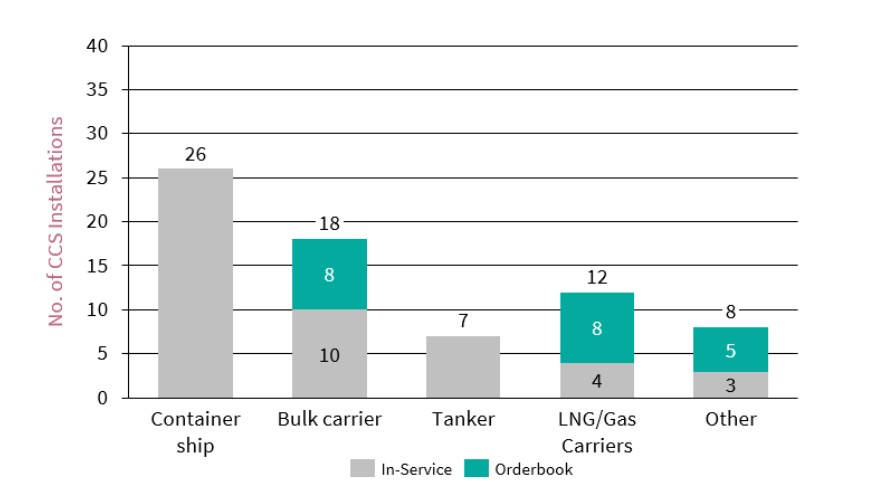
Chart showing CCS installations across container ships, bulk carriers, tankers, LNG and gas carriers, and other vessels.

Onboard carbon capture gains attention as shipping weighs near-term decarbonisation options

  • June 18, 2026
Shore power chart showing world fleet fuel consumption at berth by ship segment

Shore power gains momentum as ports and shipowners face new regulations

  • June 11, 2026
Map showing India’s major ports, including Mumbai, Chennai, Cochin, Paradip and Deendayal Port.

Maritime decarbonisation in India gathers momentum across shipping value chain

  • May 21, 2026
Line chart titled Uptake scenarios: Fuel / CO2e savings. Blue line (All-Out Wind) increases from near 0% in 2025 to about 8% by 2050; orange line (Accelerated Adoption) rises to around 4% by 2050; green line (BAU) stays near 0% throughout. X-axis shows years 2025–2050, Y-axis shows Fuel/CO2e savings from 0% to 8%.

Wind propulsion could cut global shipping emissions through targeted fleet adoption

  • April 30, 2026
Blue ammonia demand forecast chart showing growth in shipping, hydrogen carrier and power generation to 2050

Blue ammonia gains traction as scalable low-carbon fuel for maritime and power

  • April 23, 2026
Previous Page1 Page2 Page3 Page4 Next
Recent Post
Asia-North Europe offered weekly TEU capacity during Golden Week 2026

Golden Week capacity surge raises October schedule risks

September 24, 2026
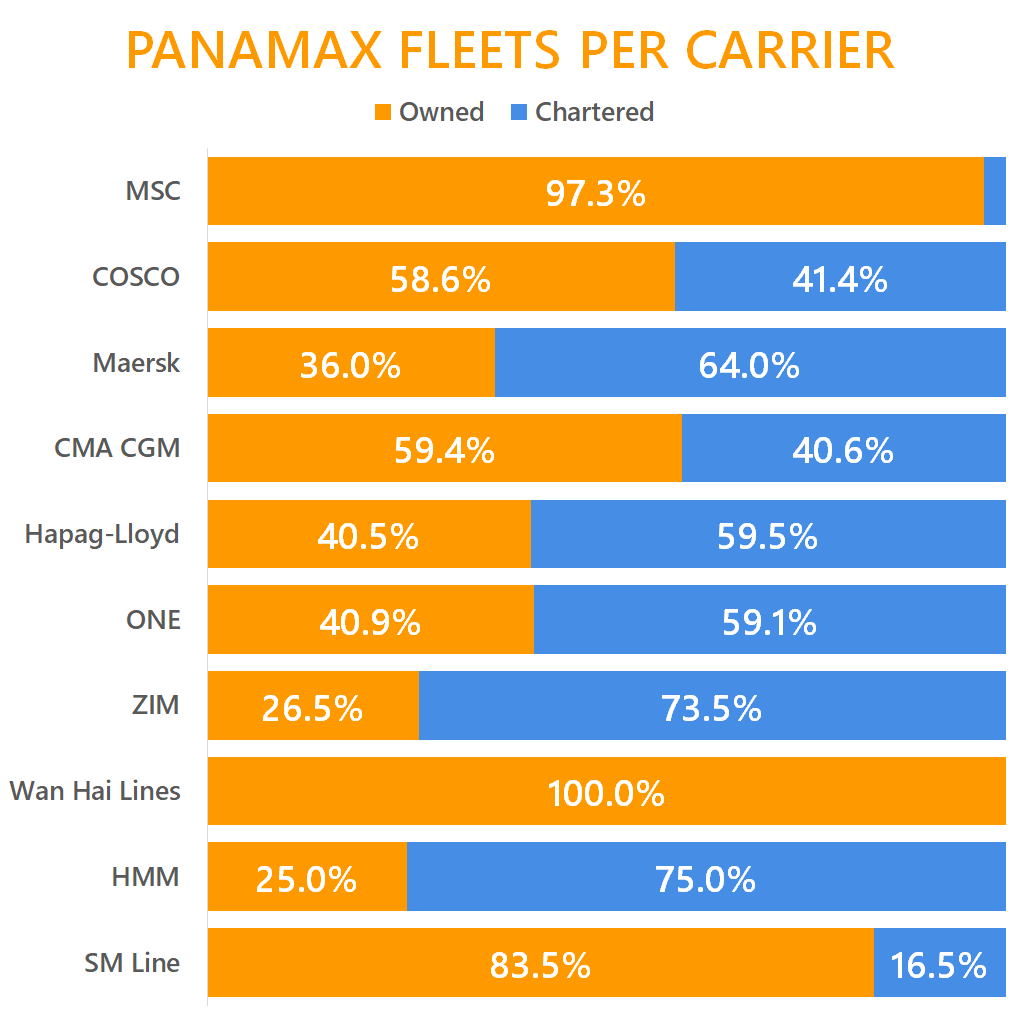
Alphaliner chart showing the percentage of fleet capacity chartered by the top-10 ocean carriers in 2026, including MSC, Maersk, CMA CGM, COSCO, Hapag-Lloyd, ONE, Evergreen, HMM, Yang Ming and ZIM.

Top-10 carriers reduce chartered tonnage exposure as owned fleets expand

September 24, 2026
Line chart of Red Sea share of Asia–Europe container capacity by direction and total; Europe→Asia (orange) peaks near 50% in early October while Asia→Europe (blue) fluctuates around 15–25%, and total Red Sea share (gray) stays ~18–30%.

Red Sea routing normalisation reaches 27% as Suez return builds

September 17, 2026
Chart comparing August 2026 and August 2025 deployed capacity for the top-20 Intra-Asia container carriers, with Maersk leading ahead of COSCO.

Maersk overtakes COSCO to lead the Intra-Asia shipping market

September 17, 2026
Trending Posts
Bunker-Weekly-Outlook

MABUX: Bunker Weekly Outlook, Week 42, 2023.

October 19, 2023
Port-throughput-drops

Port throughput drops sharply in Europe and the US

September 15, 2023
Line chart of Port Cargo Growth (2006–2025) for selected gateways, showing multiple port lines and end values around 168% for Savannah, 163% for NY/NJ, 103% for West Coast, and 58% for others. Note: based on total container volumes.

US West Coast ports regain momentum but face long road to market share recovery

May 15, 2026
Diagram of a large cargo ship labeled ALPHALINER, showing 25 bays, 15 ISO tiers, LNG dual‑fuel power, and a fully enclosed bridge (not an actual design).

Could 27,500 teu vessels redefine container ship capacity?

September 10, 2026
Global-Maritime-Hub- Logo

Maritime market intelligence platform featuring 2,200+ reports, presentations and industry insights, with new content added every week. more info

Categories

  • Shipping Economic Trends & Regions
  • Ports & Terminals
  • Piracy & Security
  • Emissions, Fuel Technology & Environment
  • Economic Impact
  • Financing
  • Ship Building
  • Hinterland & Intermodal
  • Port Environmental Impact
  • Shipping Workforce

Recent Analysis

Golden Week capacity surge raises October schedule risks

Top-10 carriers reduce chartered tonnage exposure as owned fleets expand

Red Sea routing normalisation reaches 27% as Suez return builds

Weekly Updates

Sign up to receive our weekly newsletter (each Thursday) with new shipping industry market reports, presentations & analysis.

Your subscription could not be saved. Please try again.
Your subscription has been successful.

By signing up, I agree to our TOS and Privacy Policy.

© 2026 GlobalMaritimeHub | All Rights Reserved

X-twitter Linkedin Youtube