Skip to content
Global-Maritime-Hub- Logo
X-twitter Linkedin Youtube
  • Home
  • Premium Content
  • Insights
  • Events
  • Industry Links
    • Broker
    • Certification
    • Consultant
    • Industry Association
    • Institute & Think Tank
    • Legal Experts
    • Official Institution / Body
    • Port & Port Authority
    • Recruitment Specialist
    • Research & Market Data
    • Shipping Company
    • Industry Blog
    • Trade Media
    • Training & Education
  • About Us
  • Other Hubs
    • GLOBAL LNG HUB
    • EUROPEAN GAS HUB
    • THE COAL HUB
    • GLOBAL HYDROGEN HUB
    • GLOBAL MINERALS HUB
  • FREE TRIAL
  • My account
  • Login
€0.00 0 Cart
Global-Maritime-Hub- Logo
€0.00 0 Cart
  • Home
  • Premium Content
  • Insights
  • Events
  • Industry Links
    • Broker
    • Certification
    • Consultant
    • Industry Association
    • Institute & Think Tank
    • Legal Experts
    • Official Institution / Body
    • Port & Port Authority
    • Recruitment Specialist
    • Research & Market Data
    • Shipping Company
    • Industry Blog
    • Trade Media
    • Training & Education
  • About Us
  • Other Hubs
    • GLOBAL LNG HUB
    • EUROPEAN GAS HUB
    • THE COAL HUB
    • GLOBAL HYDROGEN HUB
    • GLOBAL MINERALS HUB
  • FREE TRIAL
  • My account
  • Login
X-twitter Linkedin Youtube

© 2025 GlobalMaritimeHub | All Rights Reserved

Tag: Container shipping

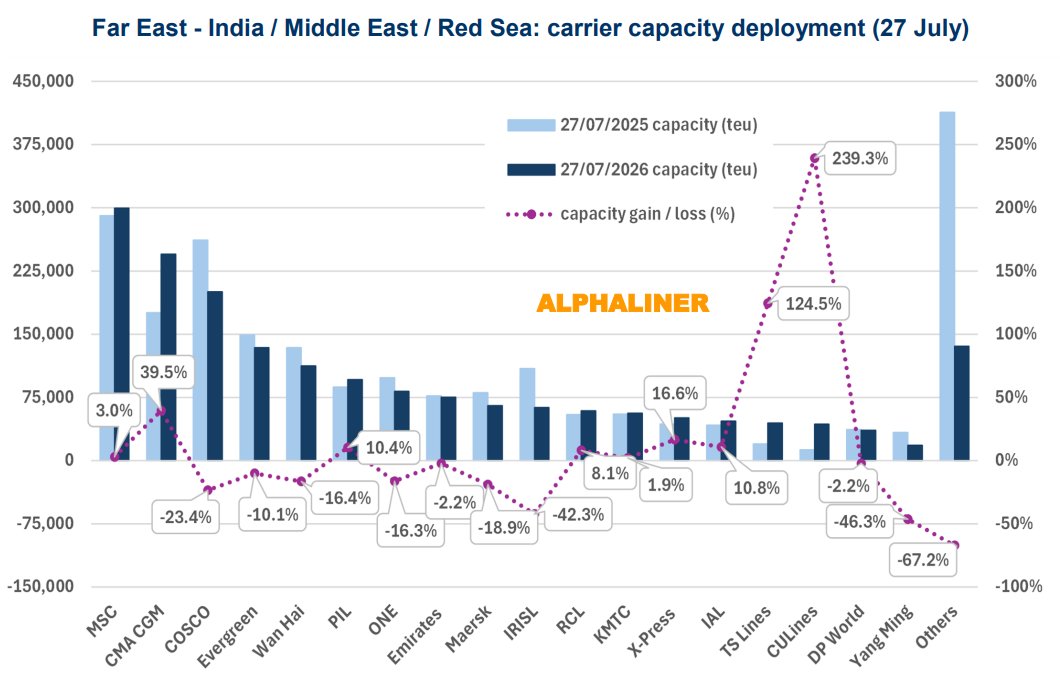
Chart comparing 2025 and 2026 carrier capacity deployment on Far East–India, Middle East and Red Sea services, with year-on-year capacity gains and losses.

Gulf conflict cuts Far East capacity by 14% year-on-year

  • August 13, 2026
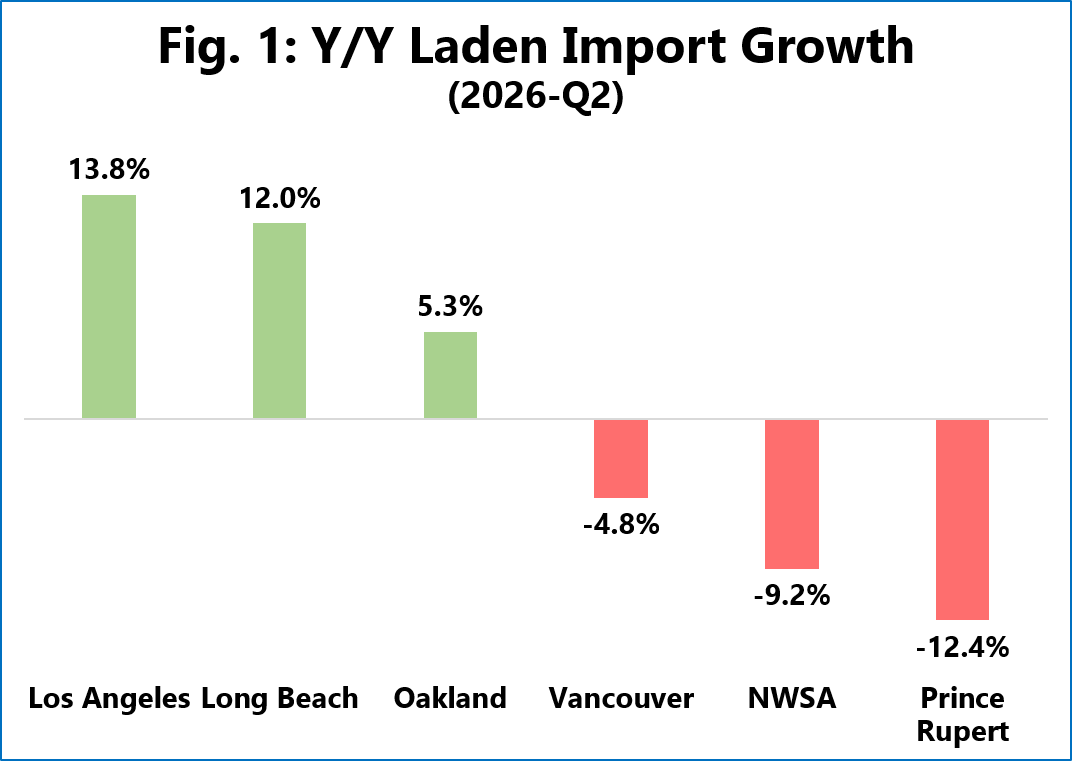
US container ports Y/Y laden import growth by West Coast port in Q2 2026

US container ports surge ahead of tariff deadlines

  • August 7, 2026
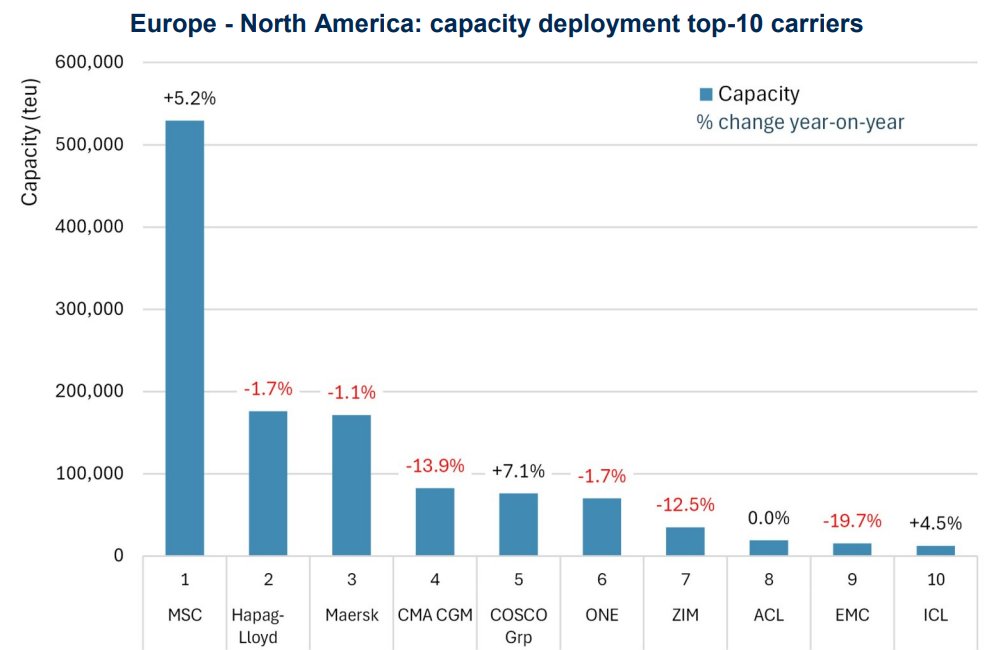
Bar chart comparing Europe–North America capacity deployment among the top-10 container carriers, led by MSC with approximately 529,000 teu.

Majority of top-10 carriers reduce Transatlantic capacity

  • August 5, 2026
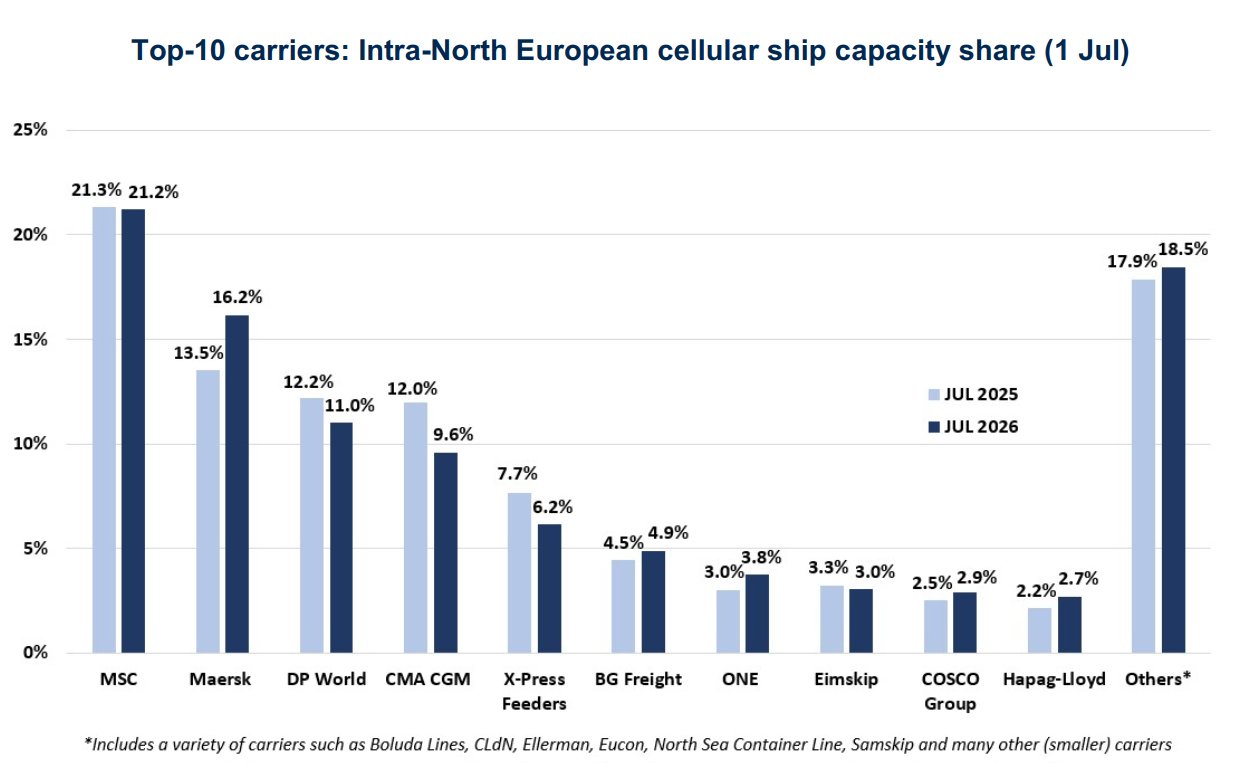
Bar chart titled 'Top-10 carriers: Intra-North European cellular ship capacity share (1 Jul)' showing two bars per carrier (JUL 2025 light blue, JUL 2026 dark blue) with percentage labels:. MSC 21.3% vs 21.2%; Maersk 13.5% vs 16.2%; DP World 12.2% vs 11.0%; CMA CGM 12.0% vs 9.6%; X-Press Feeders 7.7% vs 6.2%; BG Freight 4.5% vs 4.9%; ONE 3.0% vs 3.8%; Eimskip 3.3% vs 3.0%; COSCO Group 2.5% vs 2.9%; Hapag-Lloyd 2.2% vs 2.7%; Others 17.9% vs 18.5%.

Maersk expands capacity and market share in intra-North Europe

  • July 30, 2026
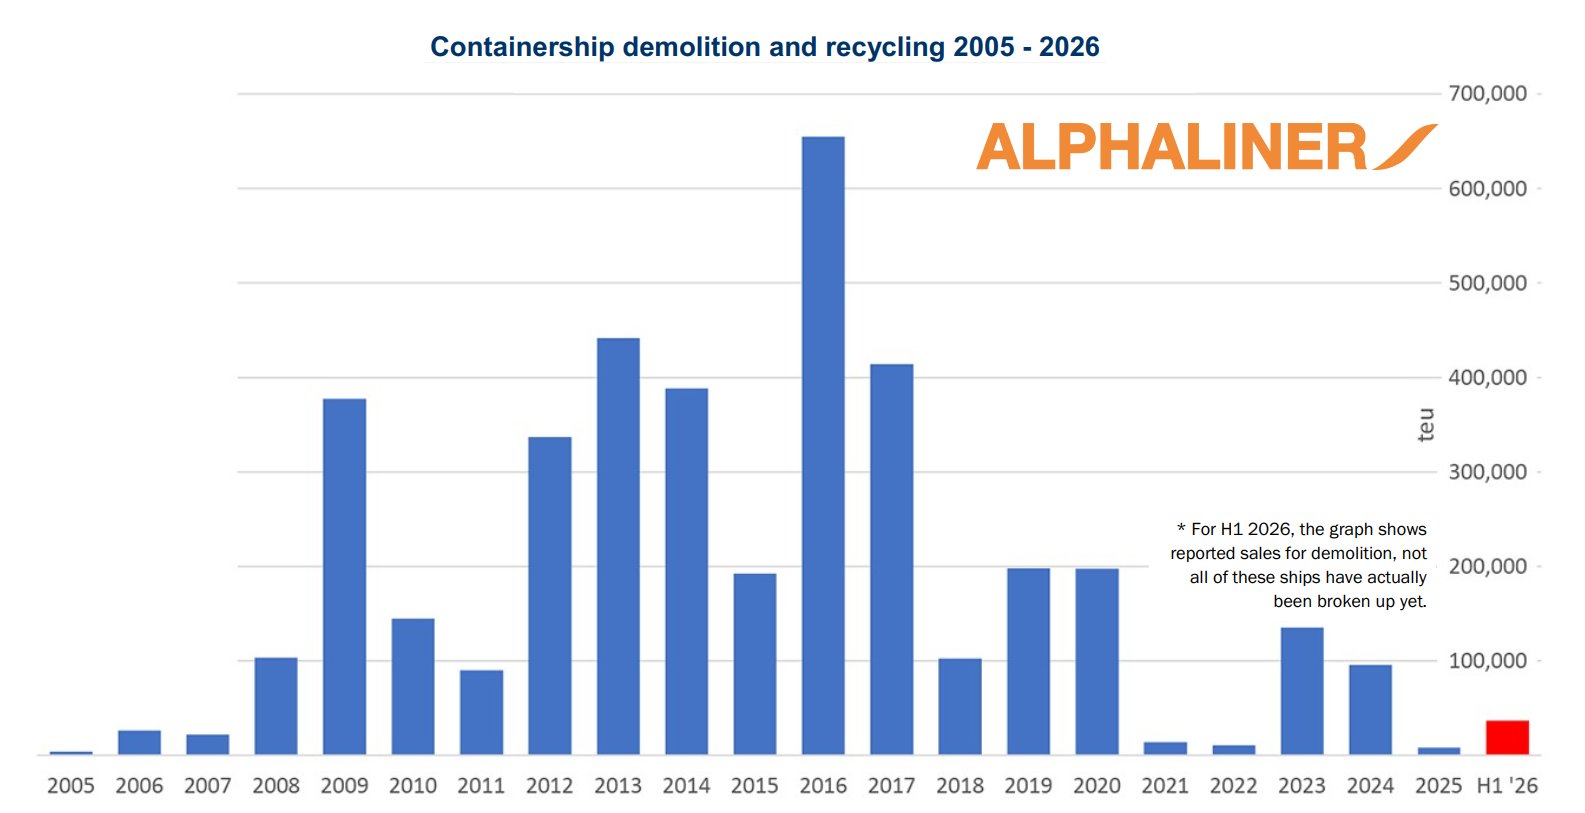
Bar chart showing containership demolition and recycling volumes from 2005 to H1 2026

Accidents and sanctions lift containership demolition sales

  • July 23, 2026
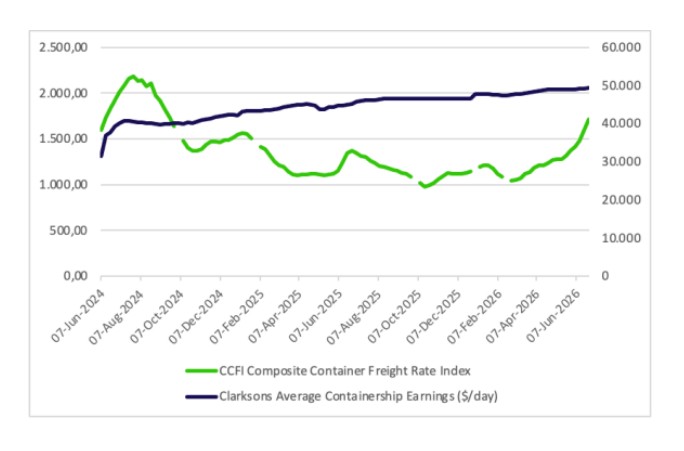
Shipping market outlook chart showing container freight rates and containership earnings through June 2026

Shipping market outlook remains resilient despite geopolitical disruption

  • July 17, 2026
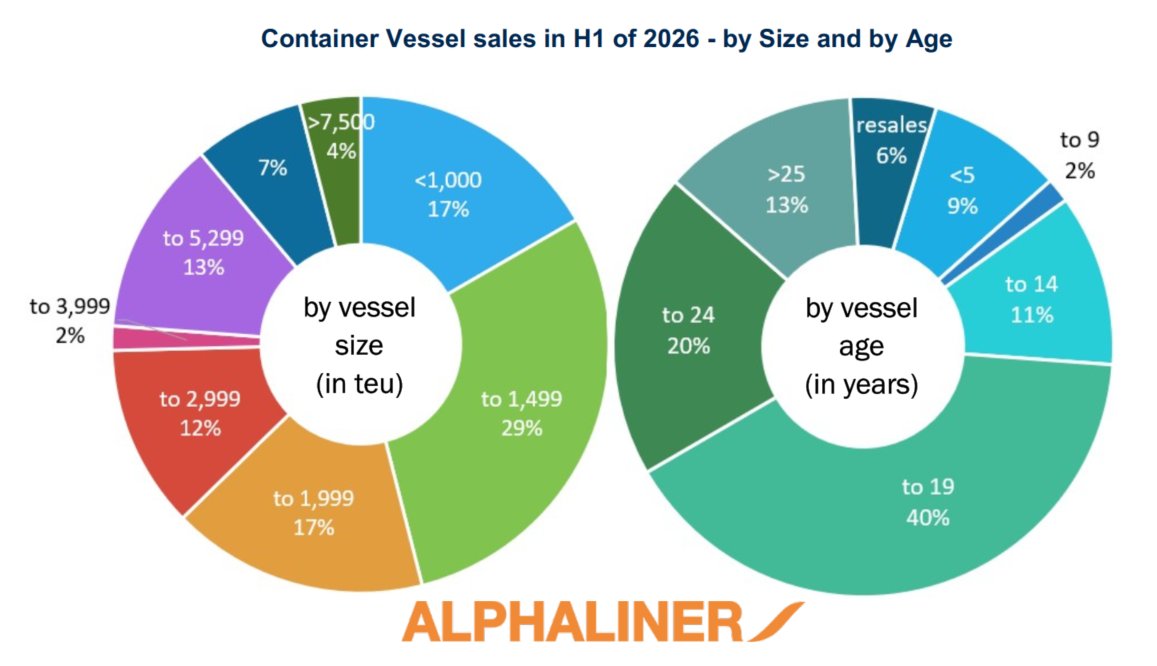
Container vessel sales in H1 2026 by ship size and vessel age

Containership sales slow in H1 despite firm market prices

  • July 16, 2026
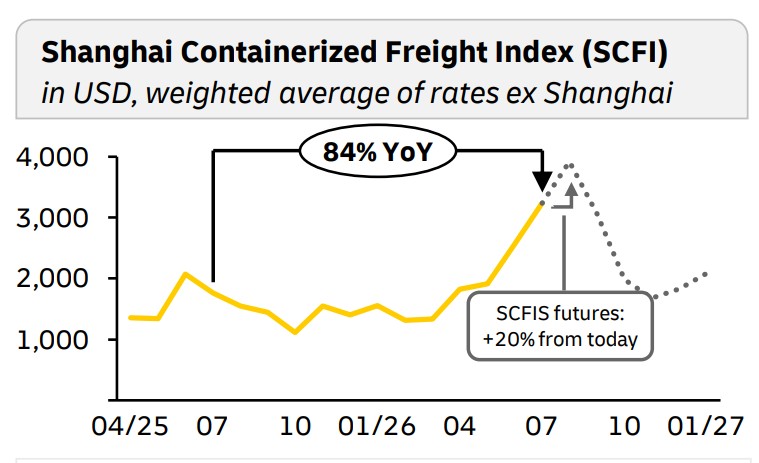
Ocean freight rates chart showing Shanghai Containerized Freight Index rising 84% year on year

Ocean freight rates expected to remain elevated through the summer peak

  • July 10, 2026
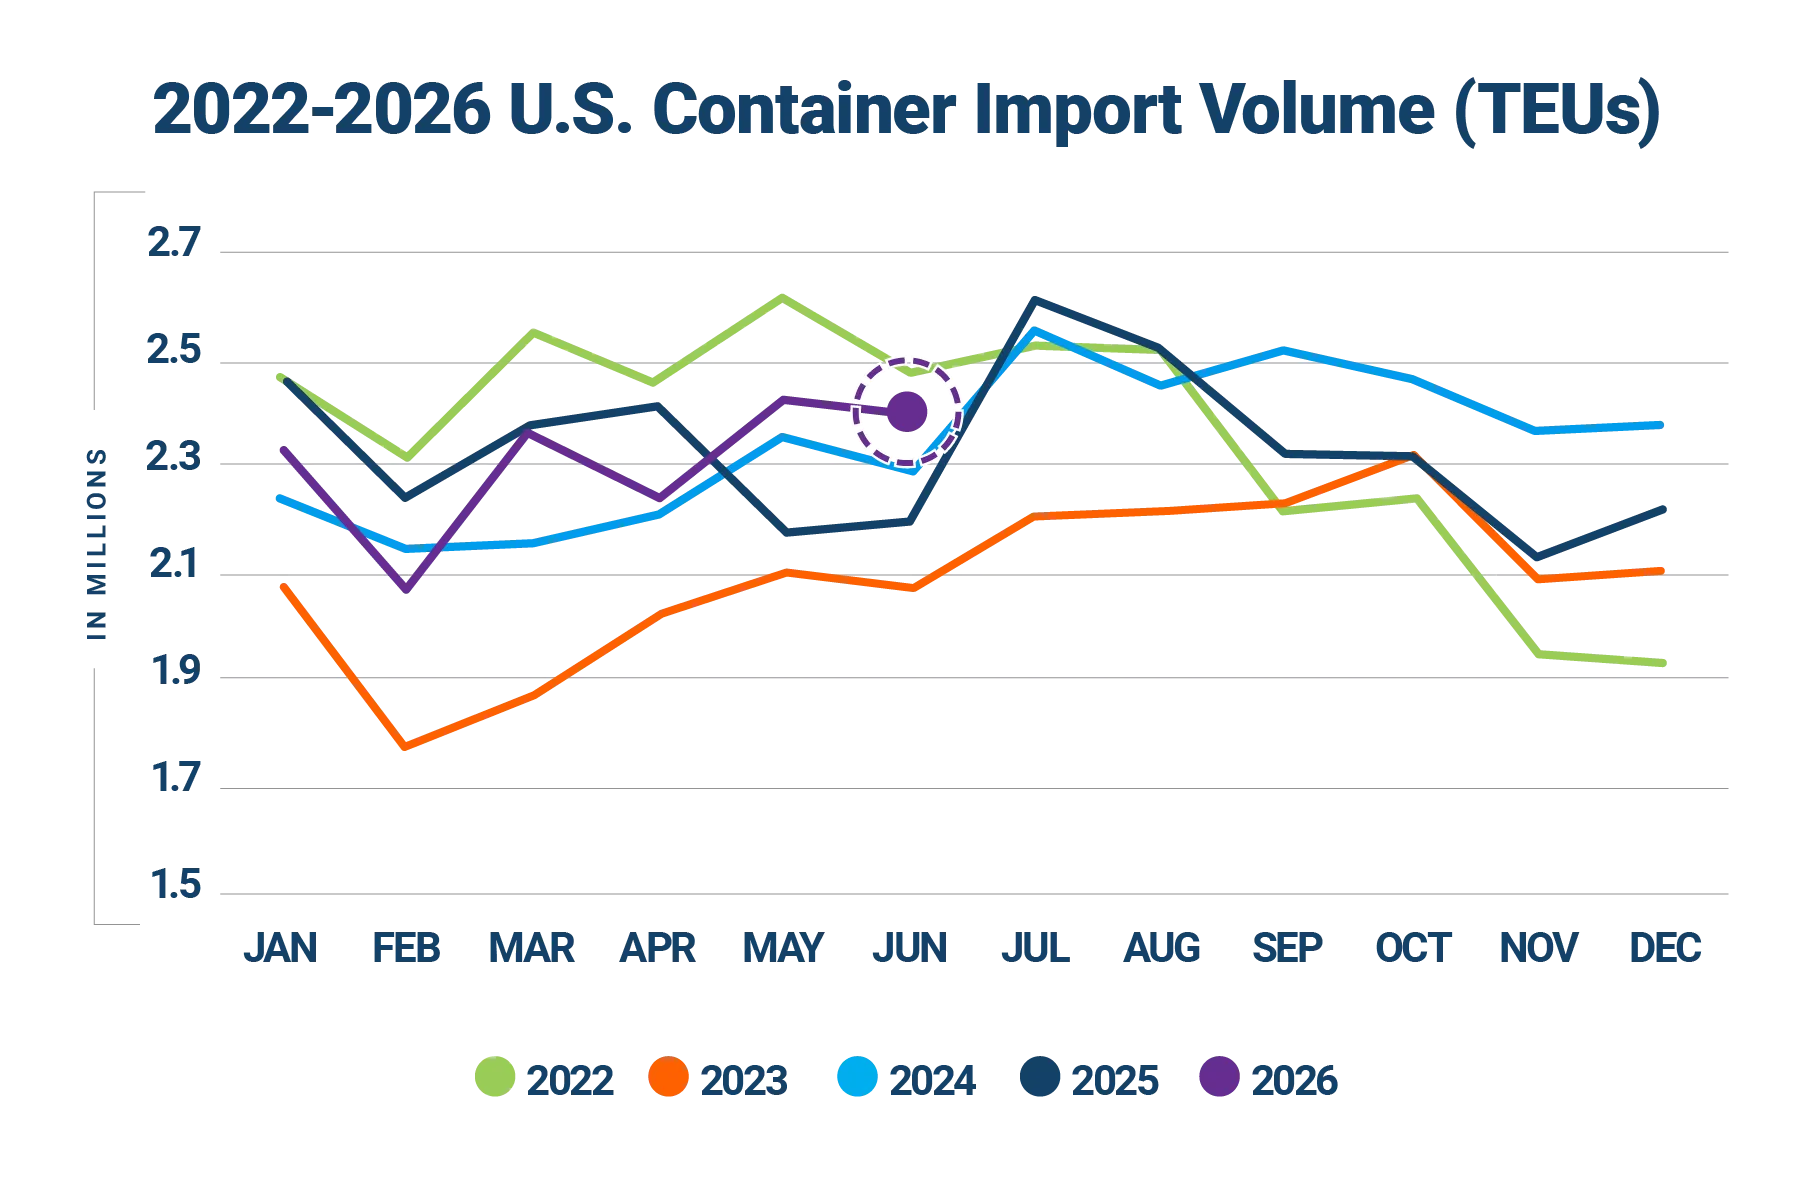
Line chart of monthly U.S. container import volumes (TEUs) by year 2022–2026; months on the x-axis, millions on the y-axis, with a purple circled data point highlighted.

US container ports remain resilient despite mounting global trade risks

  • July 10, 2026
China Europe ocean freight seasonal chart showing freight rates fading into autumn

China Europe ocean freight rates face downside risk despite current strength

  • July 10, 2026
Previous Page1 Page2 Page3 Page4 Page5 Page6 … Page21 Next
Recent Post
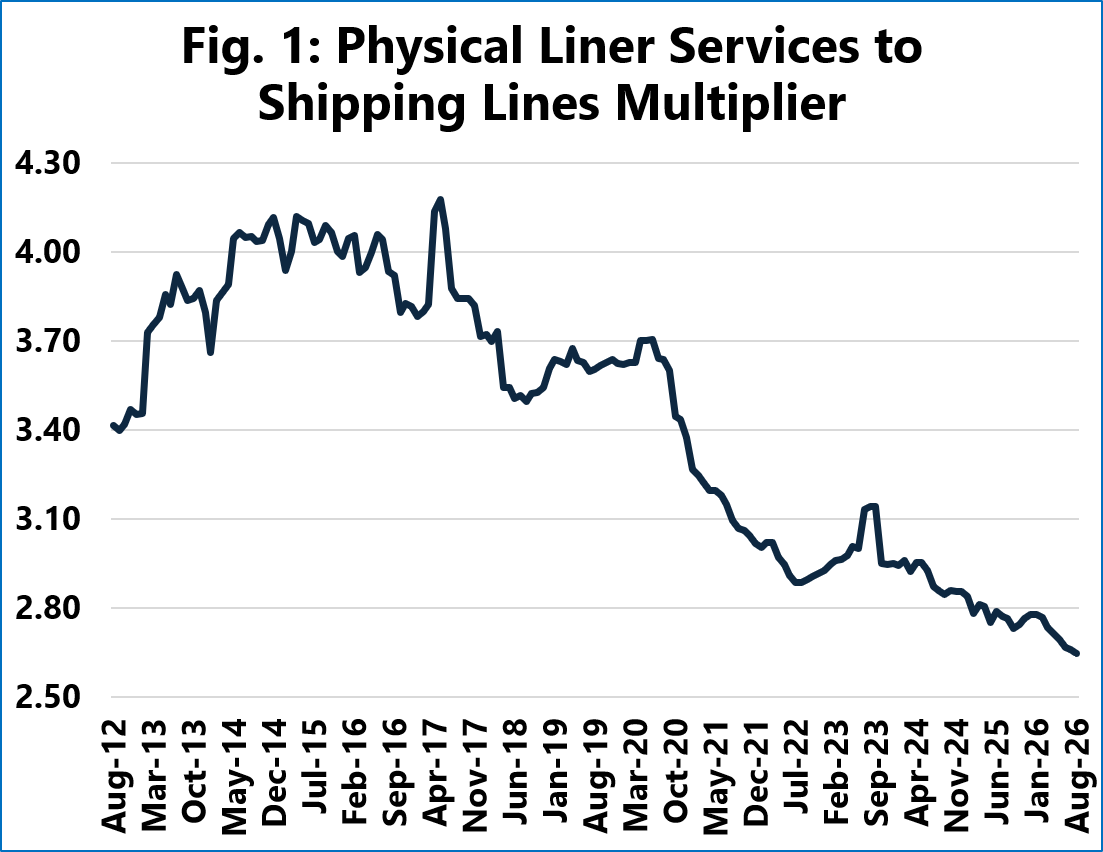
Average number of shipping lines offering each physical liner service from August 2012 to August 2026

Liner network specialization reshapes container shipping

October 15, 2026
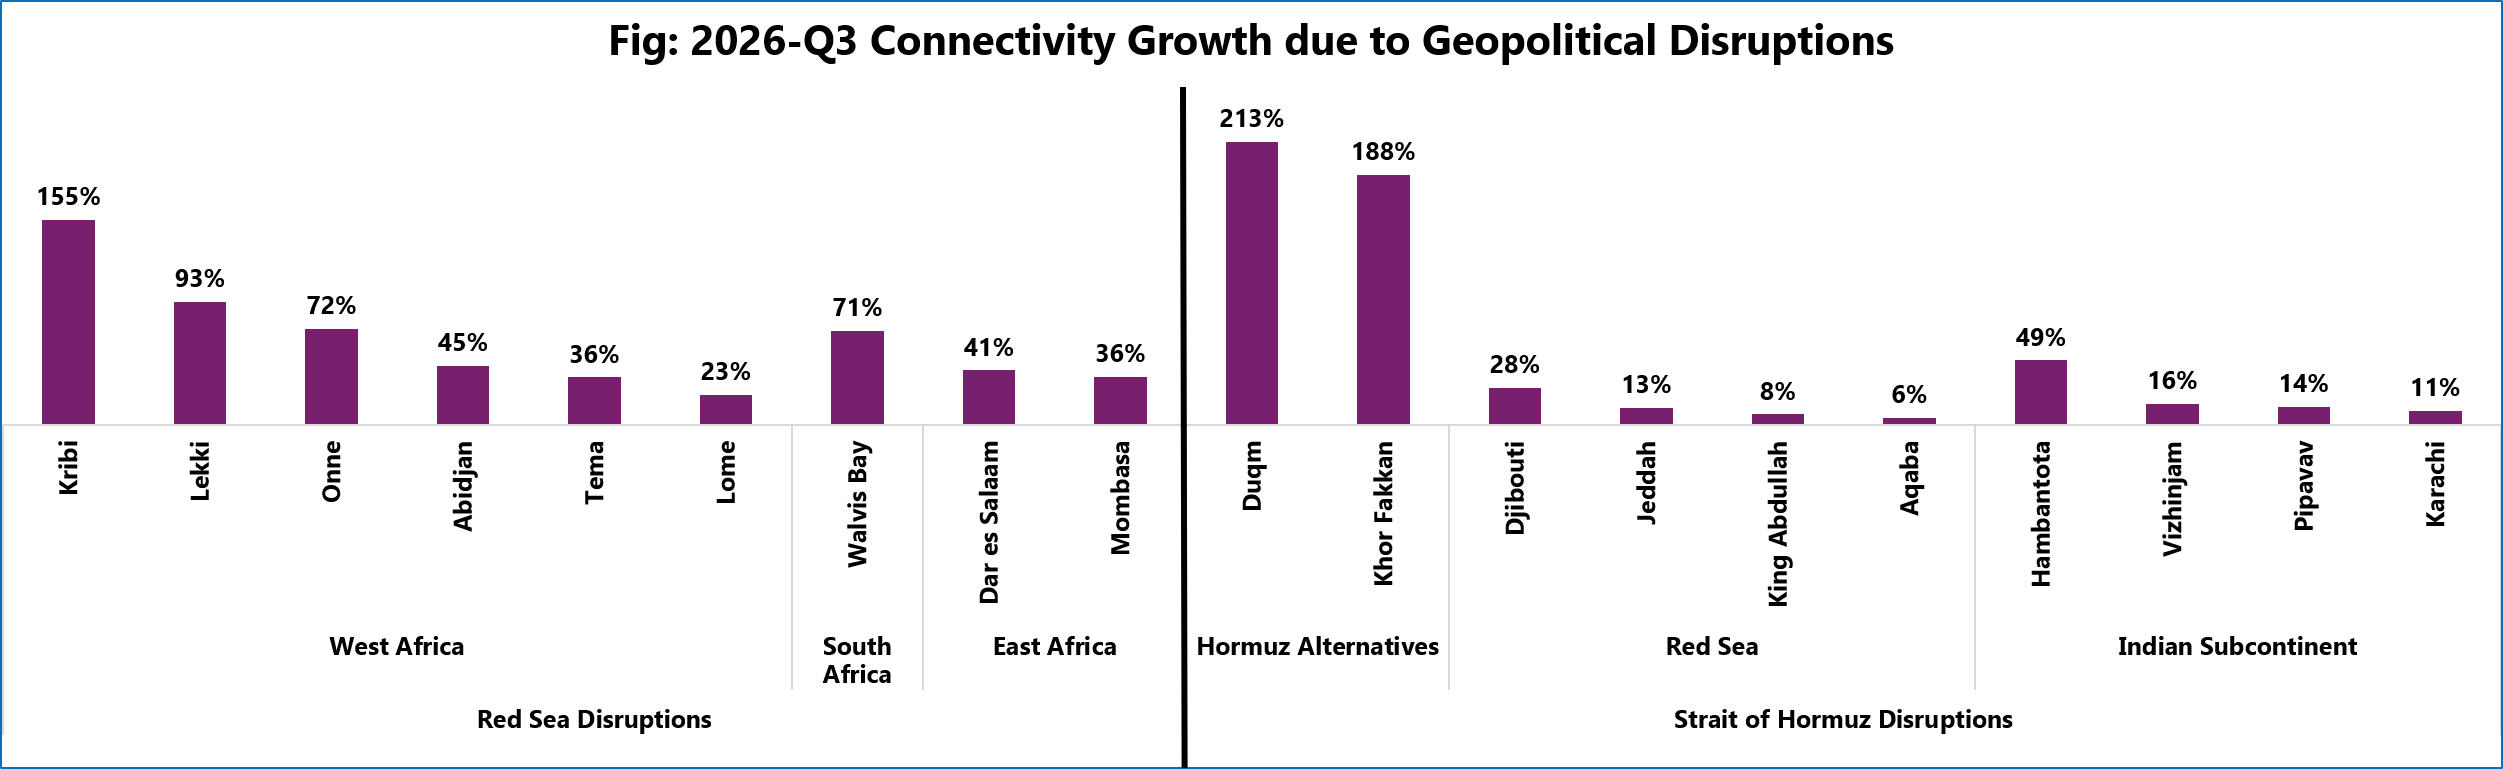
Port liner shipping connectivity growth caused by Red Sea and Strait of Hormuz disruptions in Q3 2026

Shipping connectivity shifts amid geopolitical disruptions

October 8, 2026
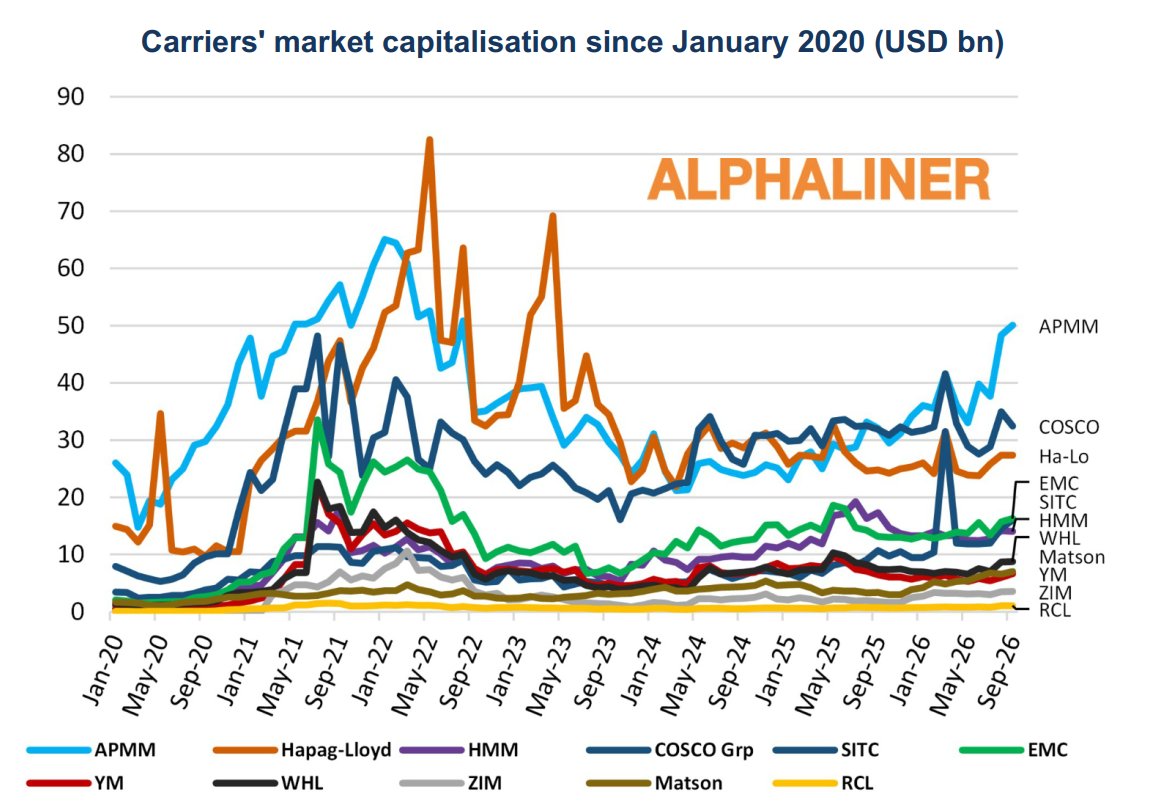
Alphaliner chart tracking the market capitalisation of major listed container carriers from January 2020 to September 2026, with AP Moller-Maersk rising to around $50 billion.

Maersk share price outlook improves as market cap tops $50 billion

October 8, 2026
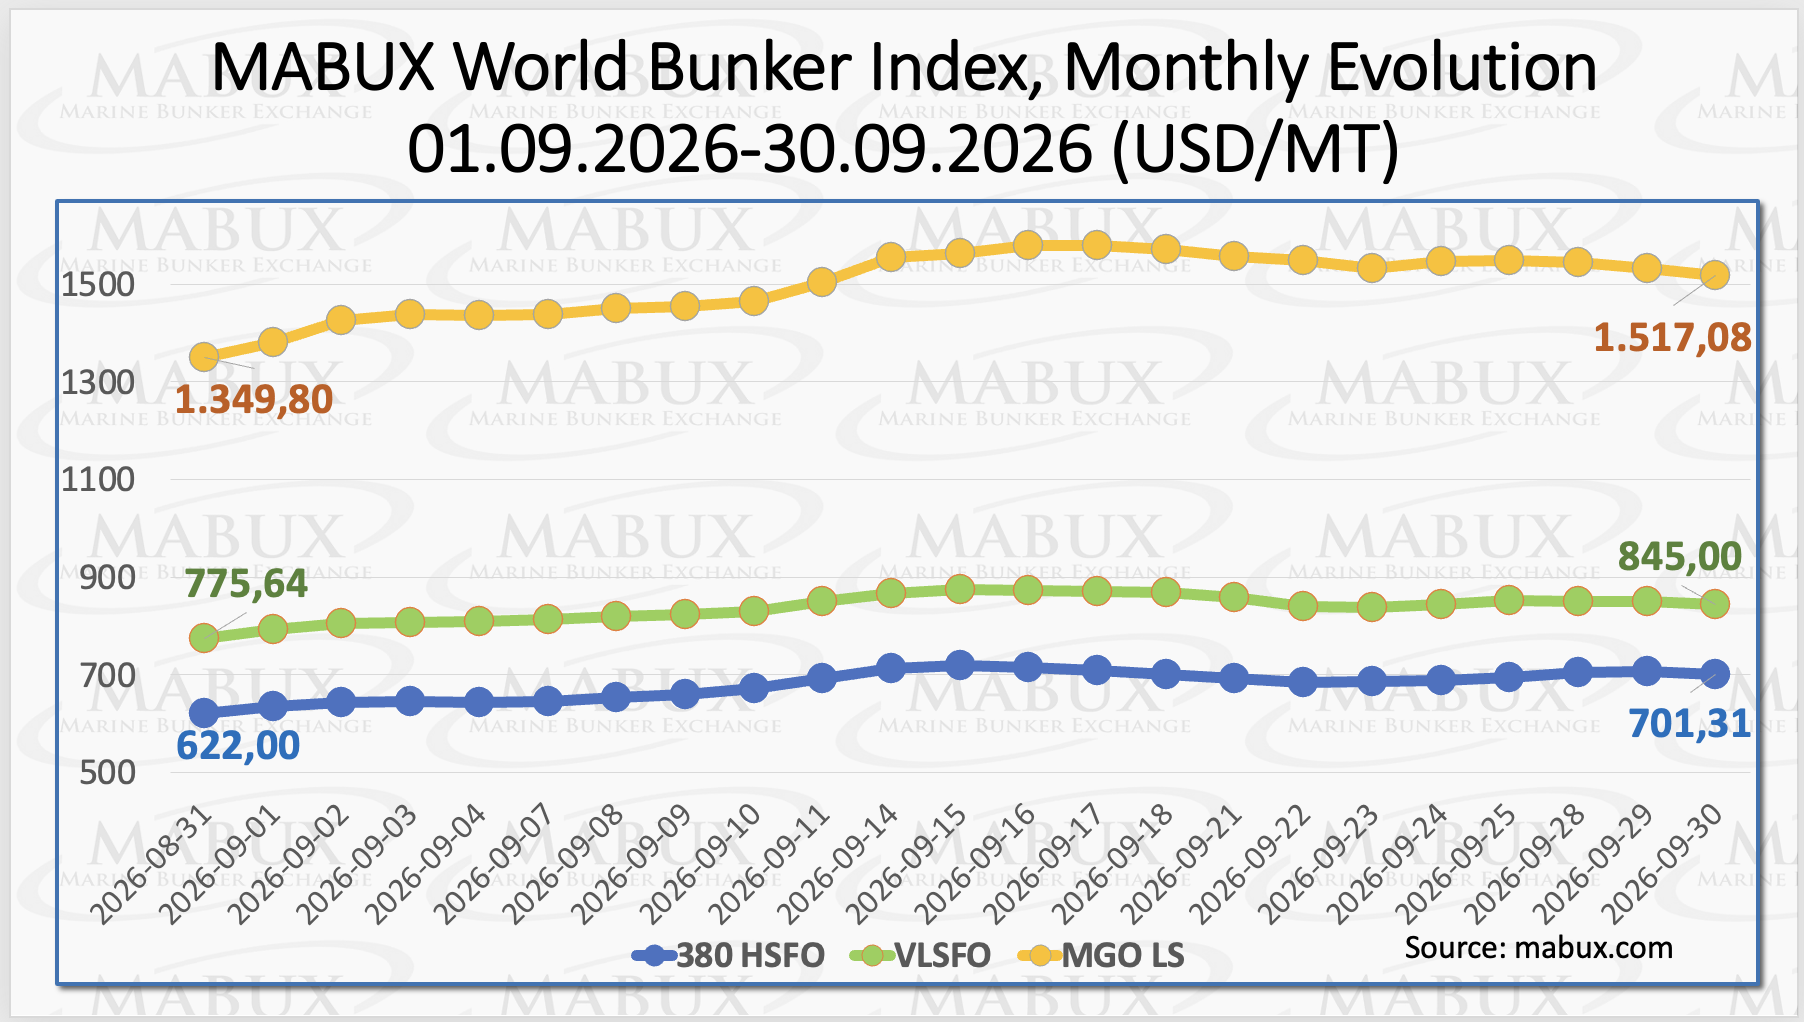
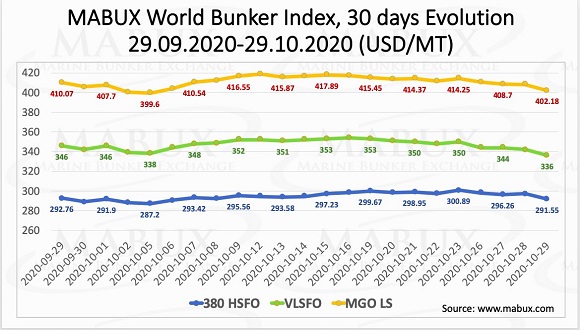
MABUX bunker fuel price index showing monthly changes in global bunker prices

Global bunker prices rise in September as Middle East tensions lift fuel markets

October 1, 2026
Trending Posts
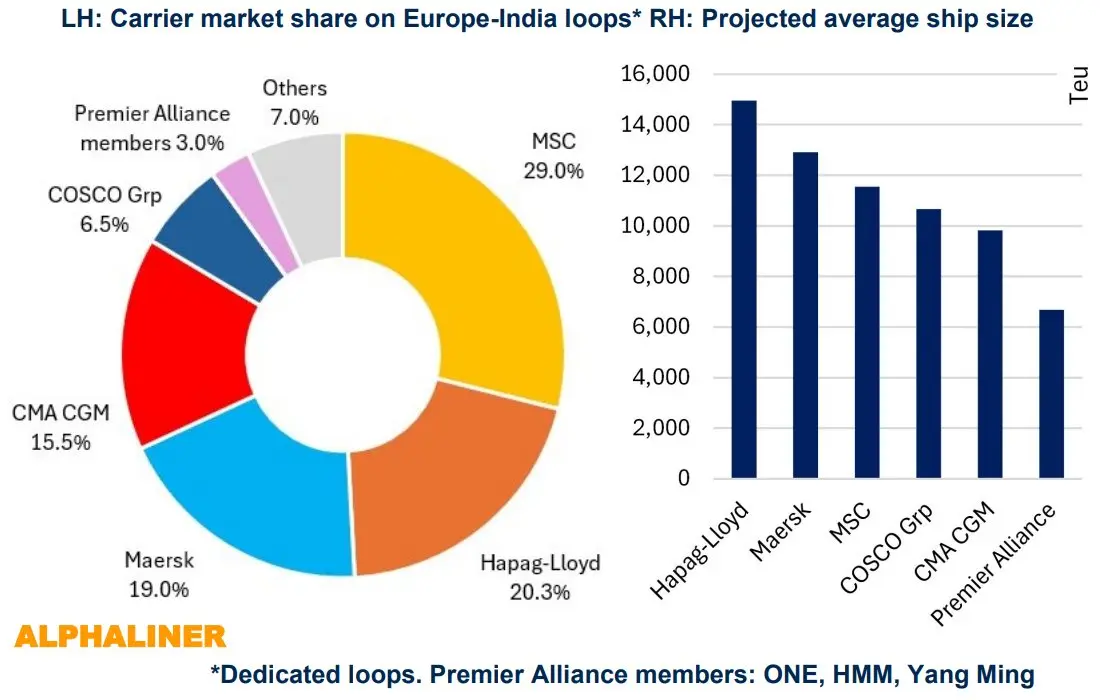
trade-between-Europe- and-India

Alliance reshuffle affects trade between Europe and India

February 20, 2025
large-cap-carriers- shrinks

Number of large cap carriers shrinks from seven to three

October 19, 2023
Shipyard-delivery-times

Shipyard delivery times offer a critical view into yard capacity and market demand

November 14, 2024

Bunker Weekly Outlook

October 29, 2020
Global-Maritime-Hub- Logo

Maritime market intelligence platform featuring 2,200+ reports, presentations and industry insights, with new content added every week. more info

Categories

  • Shipping Economic Trends & Regions
  • Ports & Terminals
  • Piracy & Security
  • Emissions, Fuel Technology & Environment
  • Economic Impact
  • Financing
  • Ship Building
  • Hinterland & Intermodal
  • Port Environmental Impact
  • Shipping Workforce

Recent Analysis

Liner network specialization reshapes container shipping

Shipping connectivity shifts amid geopolitical disruptions

Maersk share price outlook improves as market cap tops $50 billion

Weekly Updates

Sign up to receive our weekly newsletter (each Thursday) with new shipping industry market reports, presentations & analysis.

Your subscription could not be saved. Please try again.
Your subscription has been successful.

By signing up, I agree to our TOS and Privacy Policy.

© 2026 GlobalMaritimeHub | All Rights Reserved

X-twitter Linkedin Youtube
Manage Consent
To provide the best experiences, we use technologies like cookies to store and/or access device information. Consenting to these technologies will allow us to process data such as browsing behavior or unique IDs on this site. Not consenting or withdrawing consent, may adversely affect certain features and functions.
Functional Always active
The technical storage or access is strictly necessary for the legitimate purpose of enabling the use of a specific service explicitly requested by the subscriber or user, or for the sole purpose of carrying out the transmission of a communication over an electronic communications network.
Preferences
The technical storage or access is necessary for the legitimate purpose of storing preferences that are not requested by the subscriber or user.
Statistics
The technical storage or access that is used exclusively for statistical purposes. The technical storage or access that is used exclusively for anonymous statistical purposes. Without a subpoena, voluntary compliance on the part of your Internet Service Provider, or additional records from a third party, information stored or retrieved for this purpose alone cannot usually be used to identify you.
Marketing
The technical storage or access is required to create user profiles to send advertising, or to track the user on a website or across several websites for similar marketing purposes.
  • Manage options
  • Manage services
  • Manage {vendor_count} vendors
  • Read more about these purposes
View preferences
  • {title}
  • {title}
  • {title}