Skip to content
Global-Maritime-Hub- Logo
X-twitter Linkedin Youtube
  • Home
  • Premium Content
  • Insights
  • Events
  • Industry Links
    • Broker
    • Certification
    • Consultant
    • Industry Association
    • Institute & Think Tank
    • Legal Experts
    • Official Institution / Body
    • Port & Port Authority
    • Recruitment Specialist
    • Research & Market Data
    • Shipping Company
    • Industry Blog
    • Trade Media
    • Training & Education
  • About Us
  • Other Hubs
    • GLOBAL LNG HUB
    • EUROPEAN GAS HUB
    • THE COAL HUB
    • GLOBAL HYDROGEN HUB
    • GLOBAL MINERALS HUB
  • FREE TRIAL
  • My account
  • Login
€0.00 0 Cart
Global-Maritime-Hub- Logo
€0.00 0 Cart
  • Home
  • Premium Content
  • Insights
  • Events
  • Industry Links
    • Broker
    • Certification
    • Consultant
    • Industry Association
    • Institute & Think Tank
    • Legal Experts
    • Official Institution / Body
    • Port & Port Authority
    • Recruitment Specialist
    • Research & Market Data
    • Shipping Company
    • Industry Blog
    • Trade Media
    • Training & Education
  • About Us
  • Other Hubs
    • GLOBAL LNG HUB
    • EUROPEAN GAS HUB
    • THE COAL HUB
    • GLOBAL HYDROGEN HUB
    • GLOBAL MINERALS HUB
  • FREE TRIAL
  • My account
  • Login
X-twitter Linkedin Youtube

© 2025 GlobalMaritimeHub | All Rights Reserved

Ship Emissions in the Pearl River Delta Region

  • David Callanan
  • March 12, 2018
shipping analysis and trade

Characteristics of shipping activities

Ship emissions in the PRD

Ship emmision in Hong Kong

Ports and waterway intensive, Expanding ports: dual challenges, Inventory compilation method and data source
RELATED POSTS
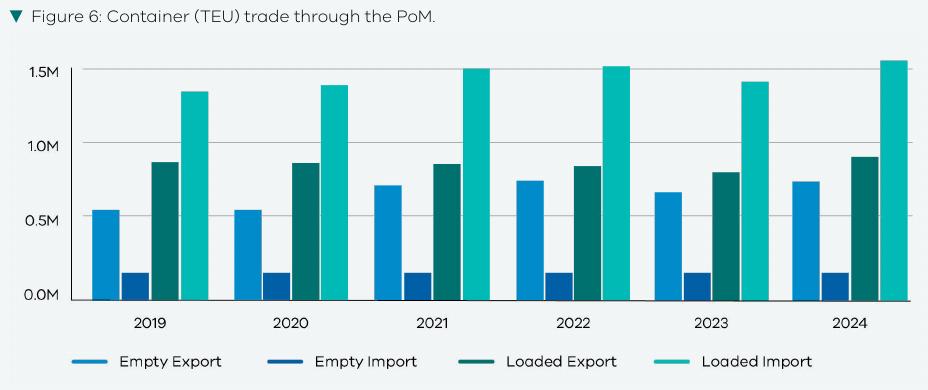
container trade: Figure 6: Port of Melbourne container trade

Port of Melbourne container trade grows 14.7% as freight logistics evolve

October 9, 2026
Port call optimisation: Fuel efficiency and port call optimisation, page 15

Port call optimisation reduces shipping fuel costs and emissions

October 9, 2026
Supply chain resilience: container ship carrying international cargo

Supply chain resilience reshapes global trade strategies

October 9, 2026
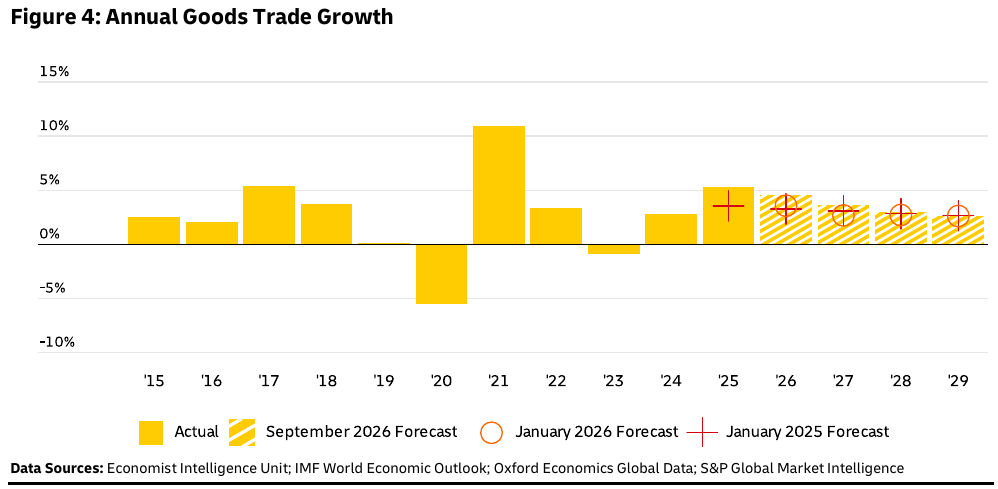
Global trade growth: Figure 4: annual goods trade growth

Global trade growth accelerates despite geopolitical disruption

October 9, 2026
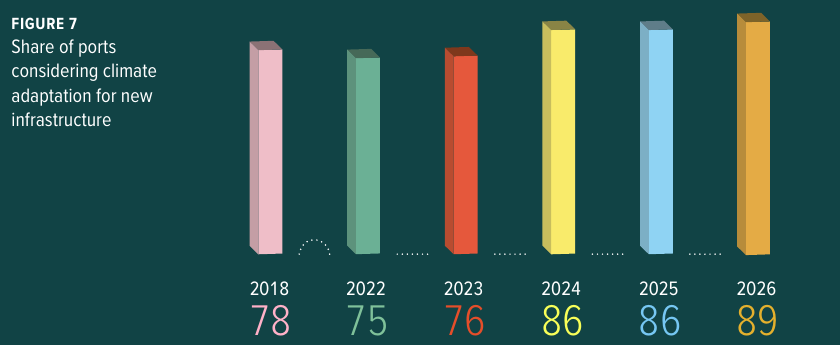
European ports: Figure 7: climate adaptation in new port infrastructure

European ports face growing pressure to deliver on environmental targets

October 9, 2026
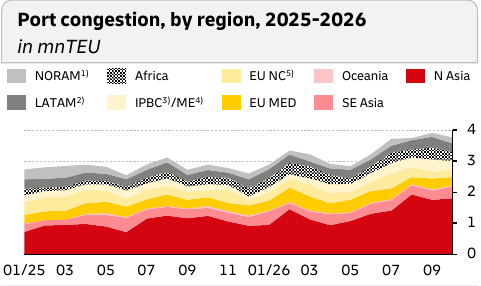
Container shipping market: Port congestion by region, slide 8

Container shipping market faces record congestion despite strong trade growth

October 9, 2026
Recent Post
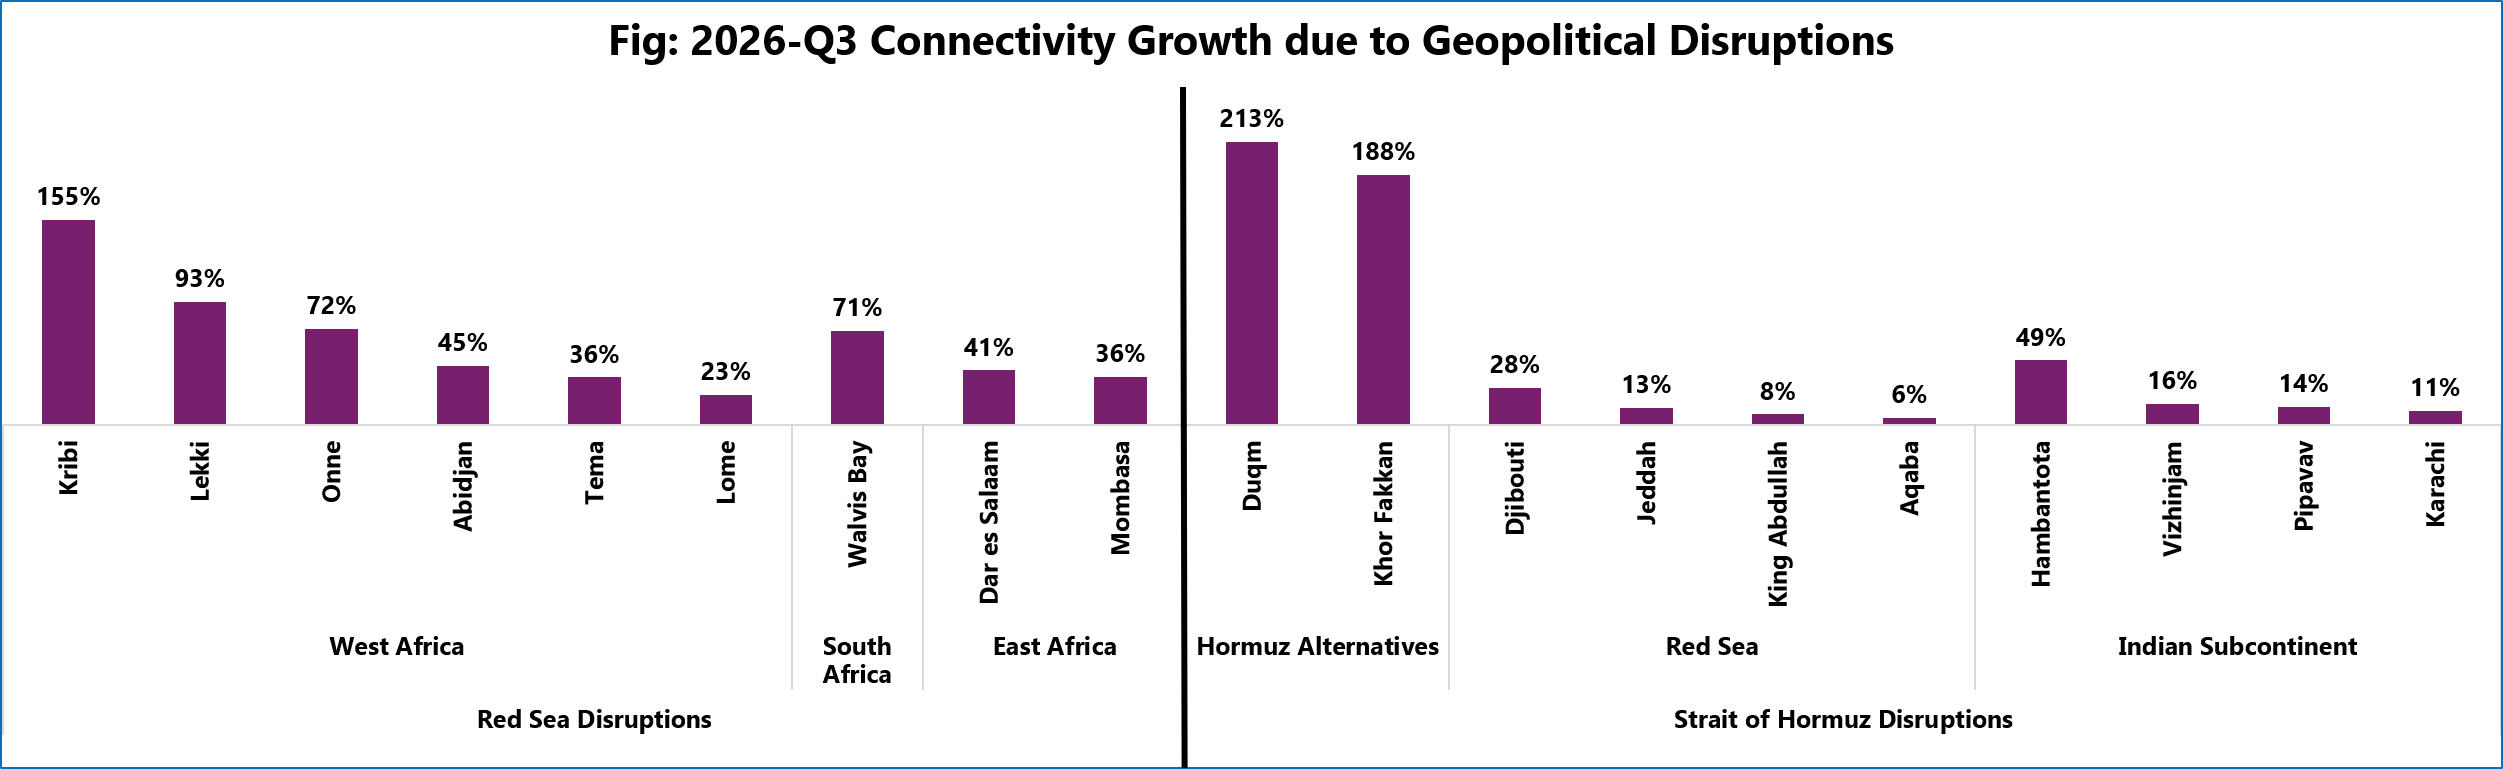
Port liner shipping connectivity growth caused by Red Sea and Strait of Hormuz disruptions in Q3 2026

Shipping connectivity shifts amid geopolitical disruptions

October 8, 2026
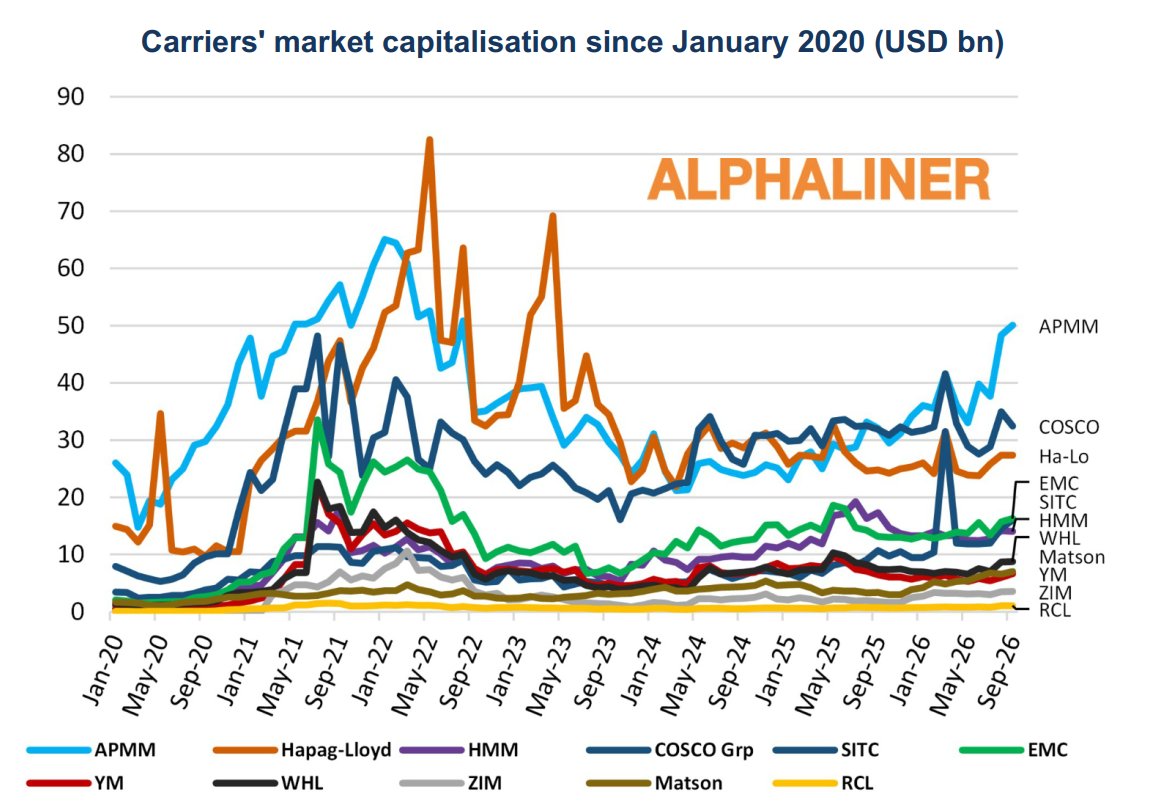
Alphaliner chart tracking the market capitalisation of major listed container carriers from January 2020 to September 2026, with AP Moller-Maersk rising to around $50 billion.

Maersk share price outlook improves as market cap tops $50 billion

October 8, 2026
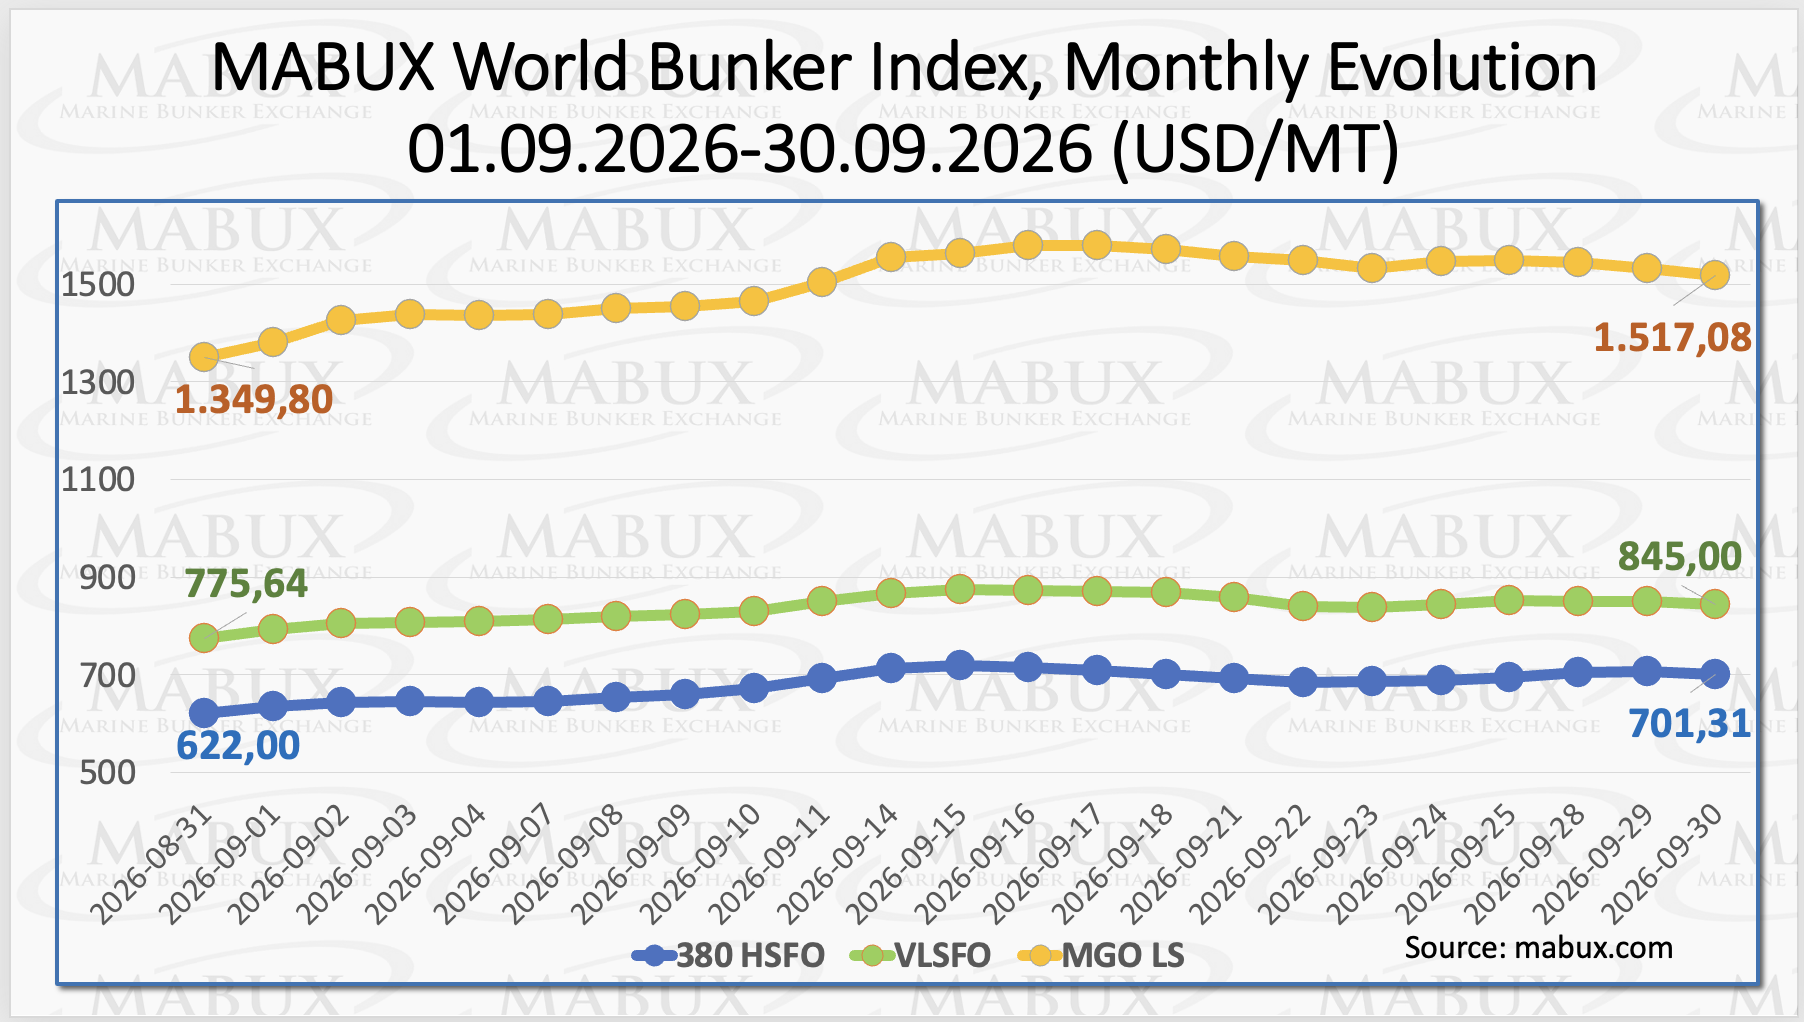
MABUX bunker fuel price index showing monthly changes in global bunker prices

Global bunker prices rise in September as Middle East tensions lift fuel markets

October 1, 2026
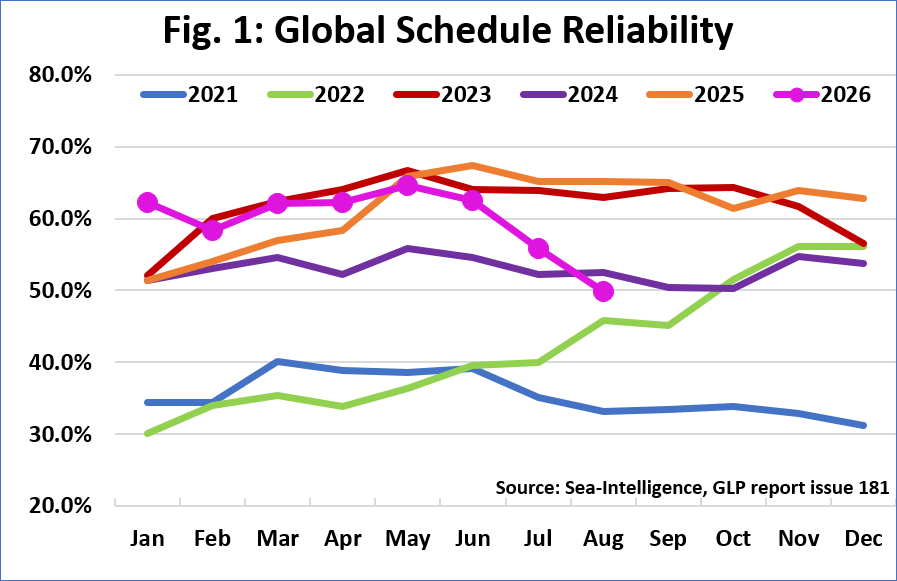
Global schedule reliability trends from 2021 to August 2026

Global schedule reliability drops below 50% in August

September 30, 2026
Trending Posts
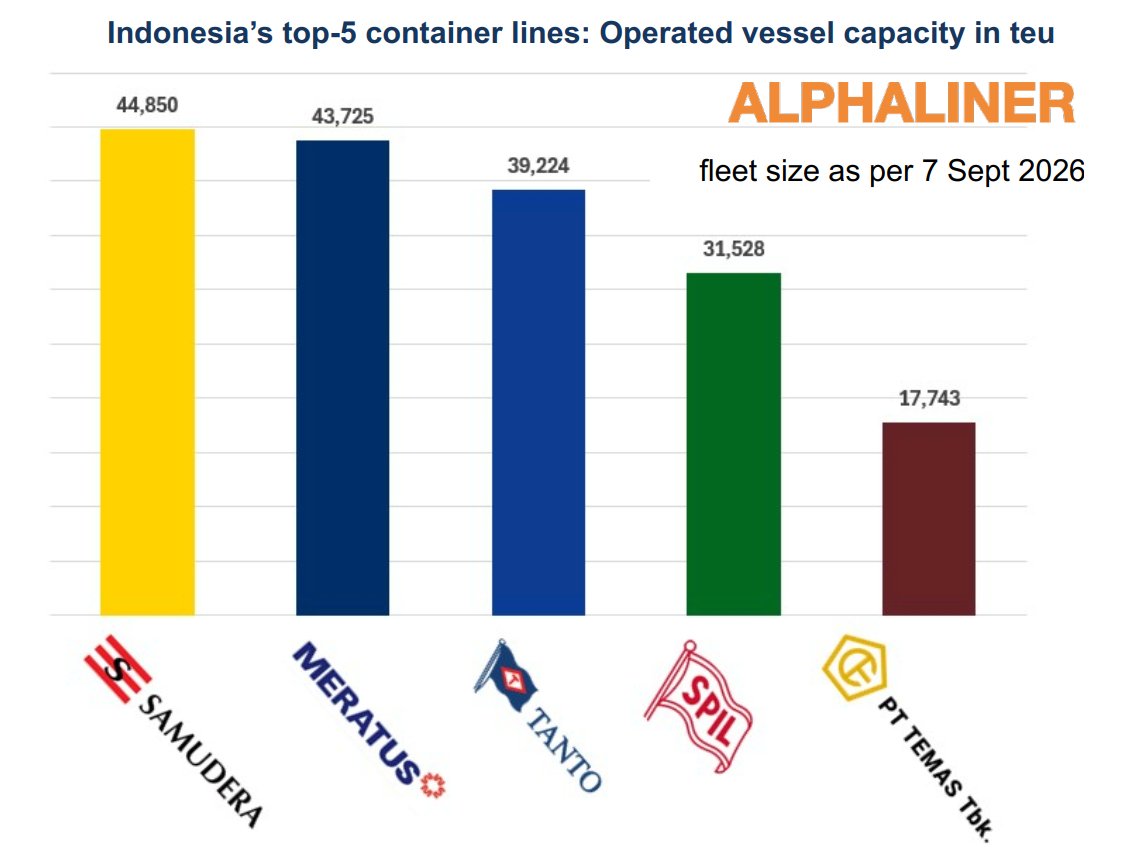
Alphaliner chart ranking Indonesia’s top-5 container lines by operated vessel capacity, led by Samudera with 44,850 teu and Meratus with 43,725 teu.

Samudera and Meratus lead Indonesia’s top container carriers

September 30, 2026
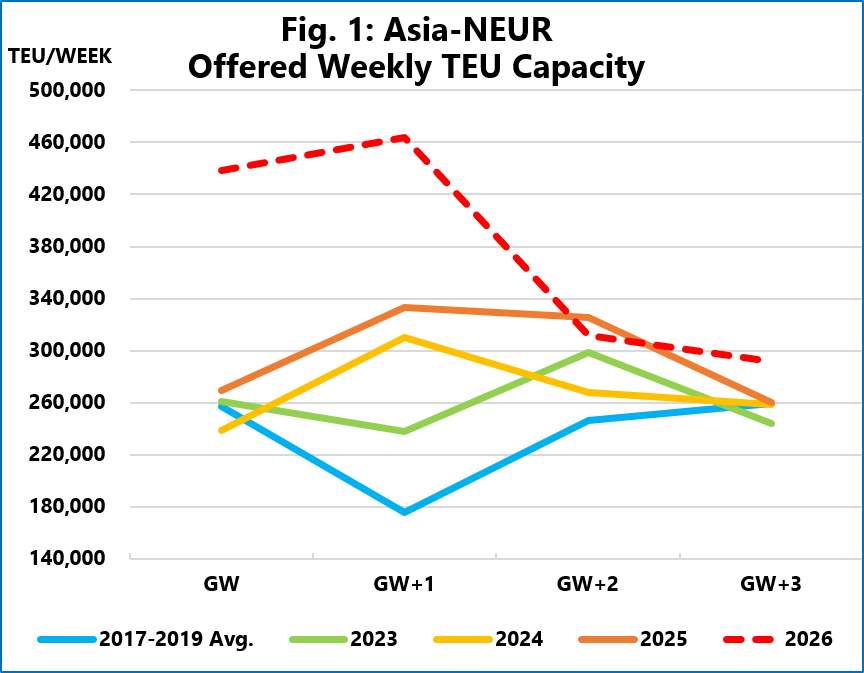
Asia-North Europe offered weekly TEU capacity during Golden Week 2026

Golden Week capacity surge raises October schedule risks

September 24, 2026
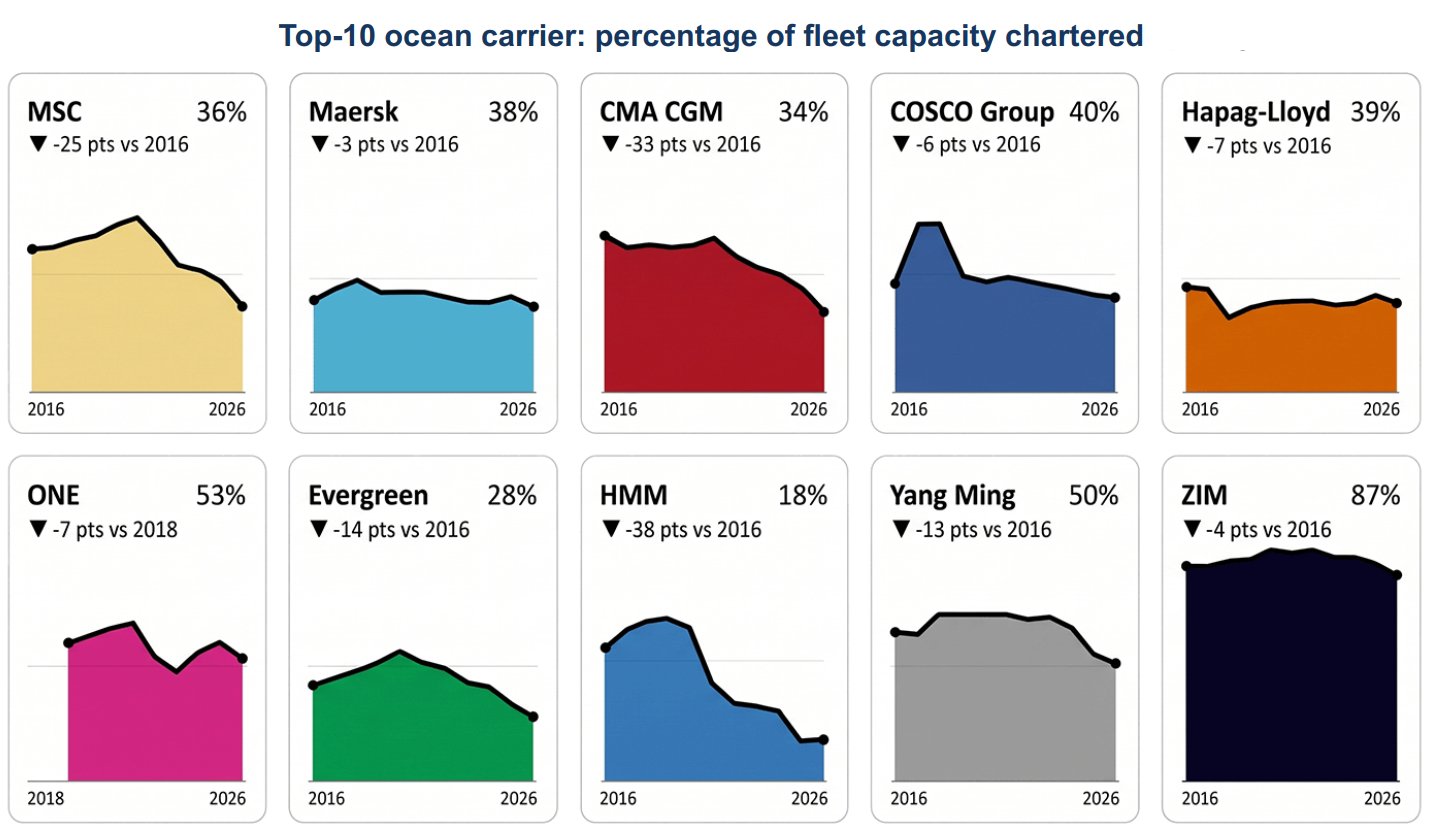
Alphaliner chart showing the percentage of fleet capacity chartered by the top-10 ocean carriers in 2026, including MSC, Maersk, CMA CGM, COSCO, Hapag-Lloyd, ONE, Evergreen, HMM, Yang Ming and ZIM.

Top-10 carriers reduce chartered tonnage exposure as owned fleets expand

September 24, 2026
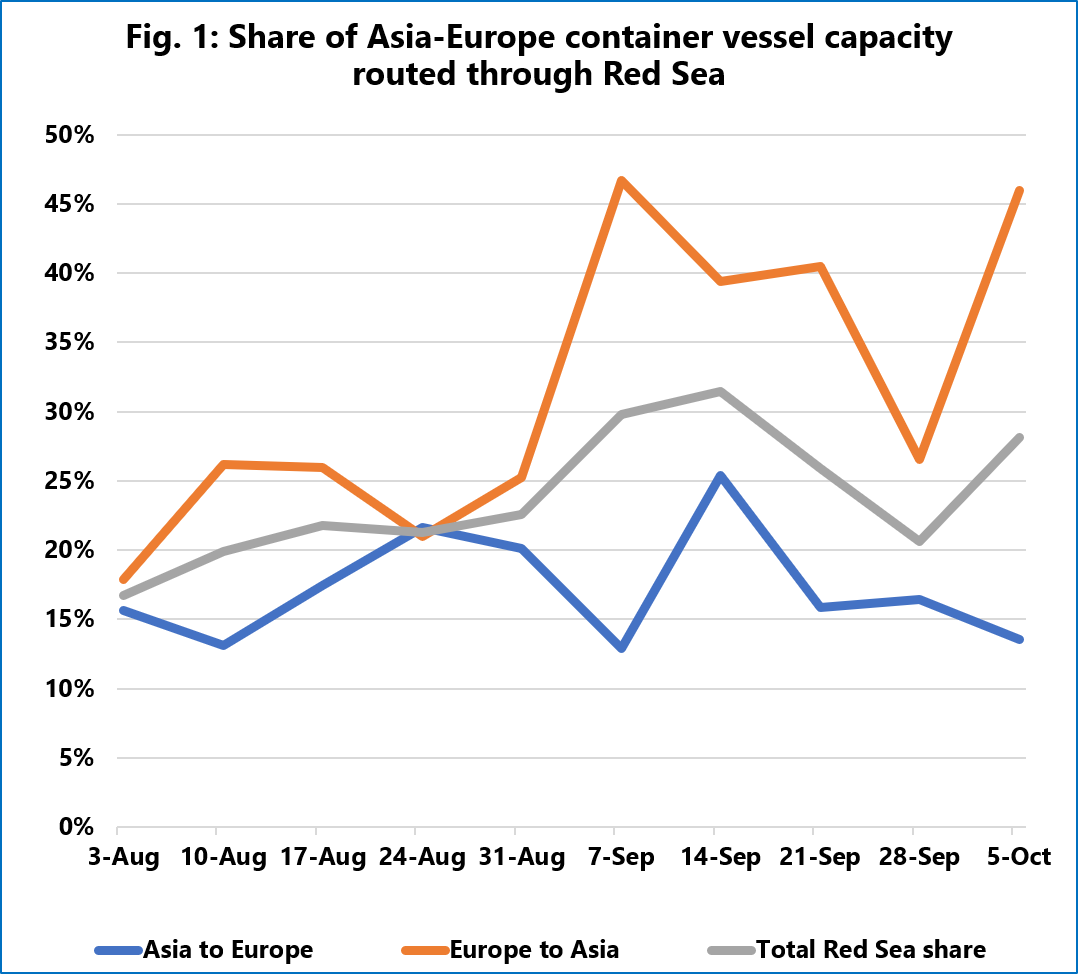
Line chart of Red Sea share of Asia–Europe container capacity by direction and total; Europe→Asia (orange) peaks near 50% in early October while Asia→Europe (blue) fluctuates around 15–25%, and total Red Sea share (gray) stays ~18–30%.

Red Sea routing normalisation reaches 27% as Suez return builds

September 17, 2026
Global-Maritime-Hub- Logo

Maritime market intelligence platform featuring 2,200+ reports, presentations and industry insights, with new content added every week. more info

Categories

  • Shipping Economic Trends & Regions
  • Ports & Terminals
  • Piracy & Security
  • Emissions, Fuel Technology & Environment
  • Economic Impact
  • Financing
  • Ship Building
  • Hinterland & Intermodal
  • Port Environmental Impact
  • Shipping Workforce

Recent Analysis

Shipping connectivity shifts amid geopolitical disruptions

Maersk share price outlook improves as market cap tops $50 billion

Global bunker prices rise in September as Middle East tensions lift fuel markets

Weekly Updates

Sign up to receive our weekly newsletter (each Thursday) with new shipping industry market reports, presentations & analysis.

Your subscription could not be saved. Please try again.
Your subscription has been successful.

By signing up, I agree to our TOS and Privacy Policy.

© 2026 GlobalMaritimeHub | All Rights Reserved

X-twitter Linkedin Youtube