Skip to content
Global-Maritime-Hub- Logo
X-twitter Linkedin Youtube
  • Home
  • Premium Content
  • Insights
  • Events
  • Industry Links
    • Broker
    • Certification
    • Consultant
    • Industry Association
    • Institute & Think Tank
    • Legal Experts
    • Official Institution / Body
    • Port & Port Authority
    • Recruitment Specialist
    • Research & Market Data
    • Shipping Company
    • Industry Blog
    • Trade Media
    • Training & Education
  • About Us
  • Other Hubs
    • GLOBAL LNG HUB
    • EUROPEAN GAS HUB
    • THE COAL HUB
    • GLOBAL HYDROGEN HUB
    • GLOBAL MINERALS HUB
  • FREE TRIAL
  • My account
  • Login
€0.00 0 Cart
Global-Maritime-Hub- Logo
€0.00 0 Cart
  • Home
  • Premium Content
  • Insights
  • Events
  • Industry Links
    • Broker
    • Certification
    • Consultant
    • Industry Association
    • Institute & Think Tank
    • Legal Experts
    • Official Institution / Body
    • Port & Port Authority
    • Recruitment Specialist
    • Research & Market Data
    • Shipping Company
    • Industry Blog
    • Trade Media
    • Training & Education
  • About Us
  • Other Hubs
    • GLOBAL LNG HUB
    • EUROPEAN GAS HUB
    • THE COAL HUB
    • GLOBAL HYDROGEN HUB
    • GLOBAL MINERALS HUB
  • FREE TRIAL
  • My account
  • Login
X-twitter Linkedin Youtube

© 2025 GlobalMaritimeHub | All Rights Reserved

Tag: LNG as marine fuel

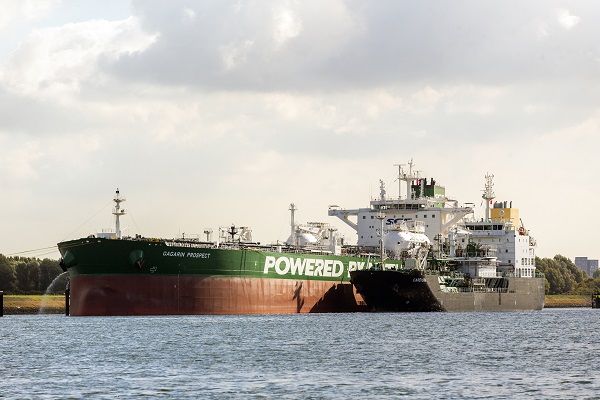
LNG as marine fuel emissions chart comparing fossil LNG, bio-LNG and synthetic LNG pathways in shipping

LNG as marine fuel cuts shipping emissions but methane slip keeps decarbonisation pressure on the sector

  • April 16, 2026
LNG-for-shipping

Shipping emissions: LNG is not the holy grail for shipping

  • March 14, 2024
Canadian-LNG

LNG as a marine fuel for Canada’s arctic

  • February 16, 2023
LNG-AS-MARINE-FUEL

LNG as a marine fuel: the momentum continues

  • January 19, 2023
BIO-LNG

The role of bio LNG in the decarbonisation of shipping

  • October 19, 2022
Fuel maritime confusion

Maritime fuel confusion

  • July 29, 2021

View from the bridge: LNG 2021

  • February 17, 2021

LNG in Marine Industries

  • October 16, 2019
Recent Post
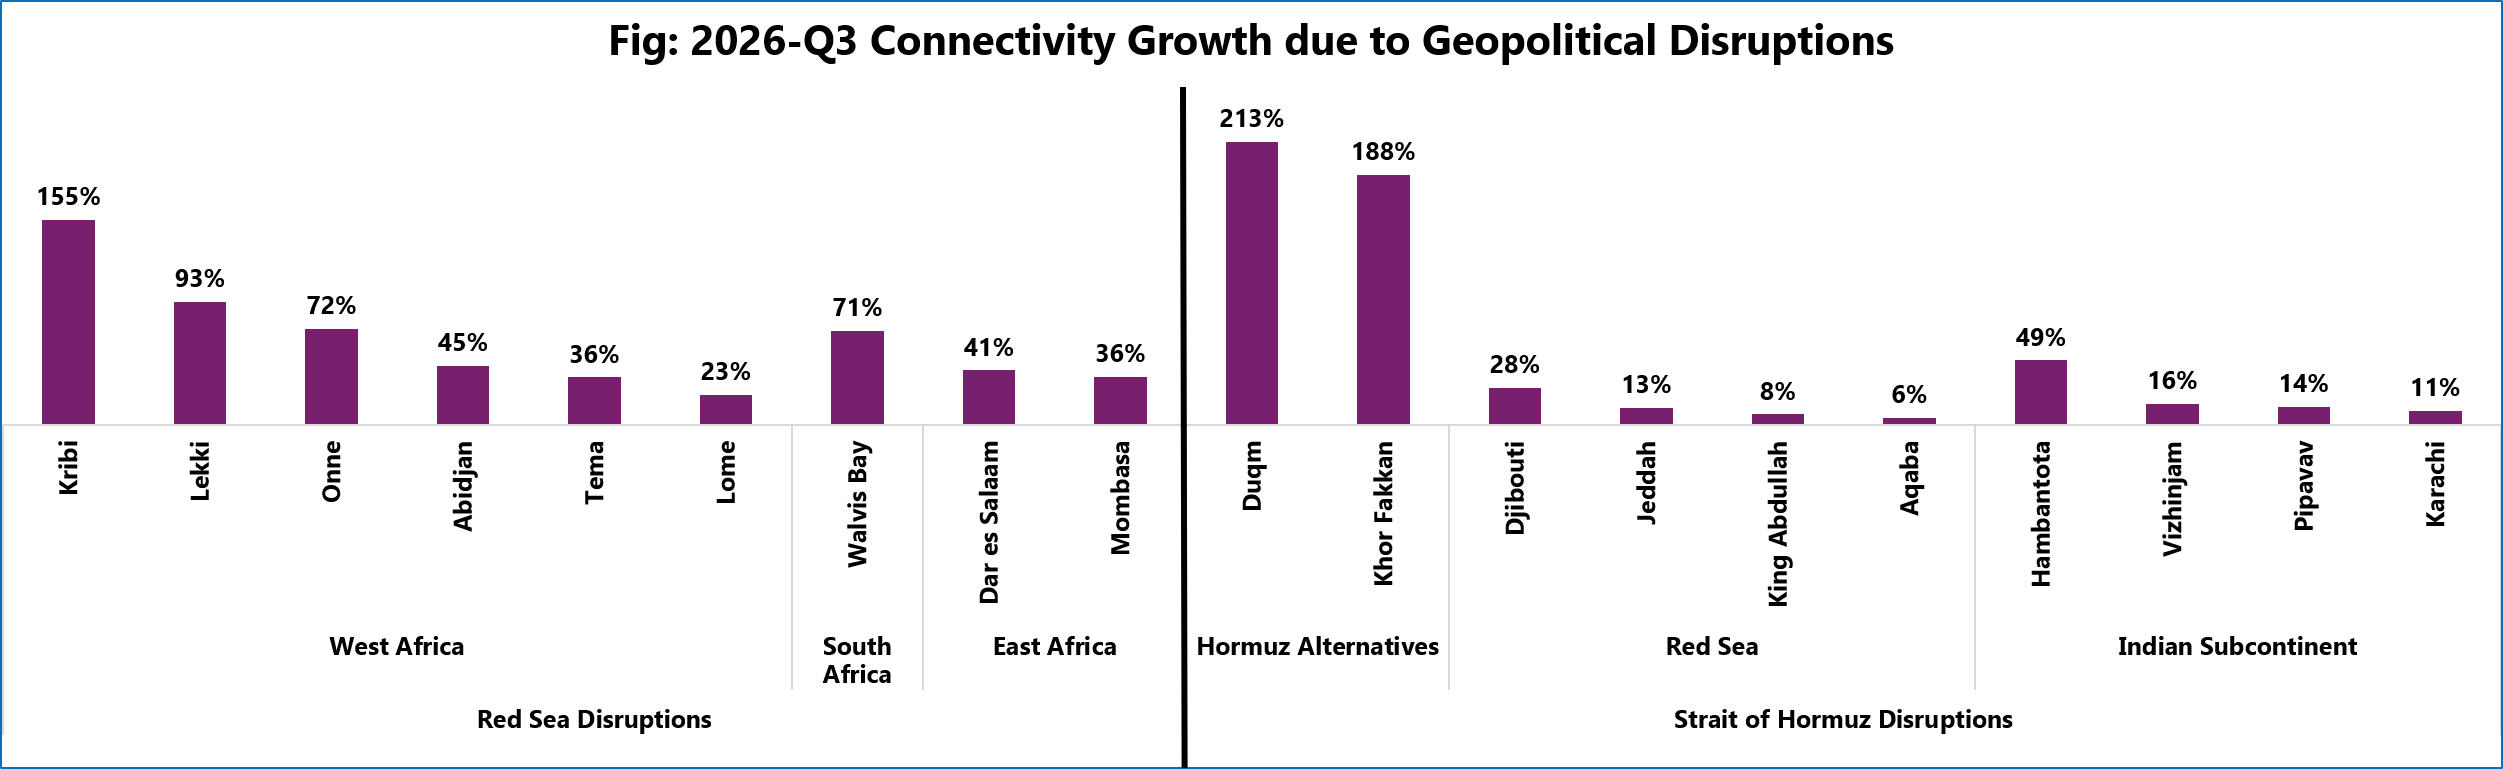
Port liner shipping connectivity growth caused by Red Sea and Strait of Hormuz disruptions in Q3 2026

Shipping connectivity shifts amid geopolitical disruptions

October 8, 2026
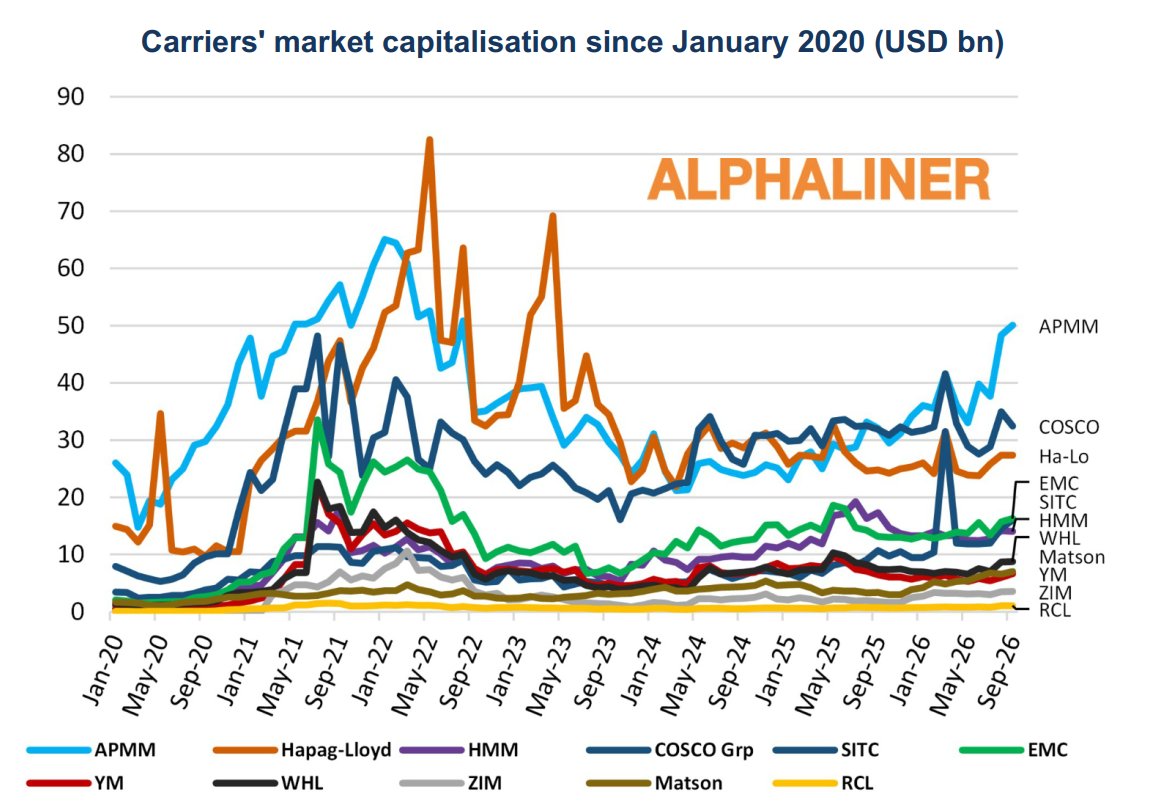
Alphaliner chart tracking the market capitalisation of major listed container carriers from January 2020 to September 2026, with AP Moller-Maersk rising to around $50 billion.

Maersk share price outlook improves as market cap tops $50 billion

October 8, 2026
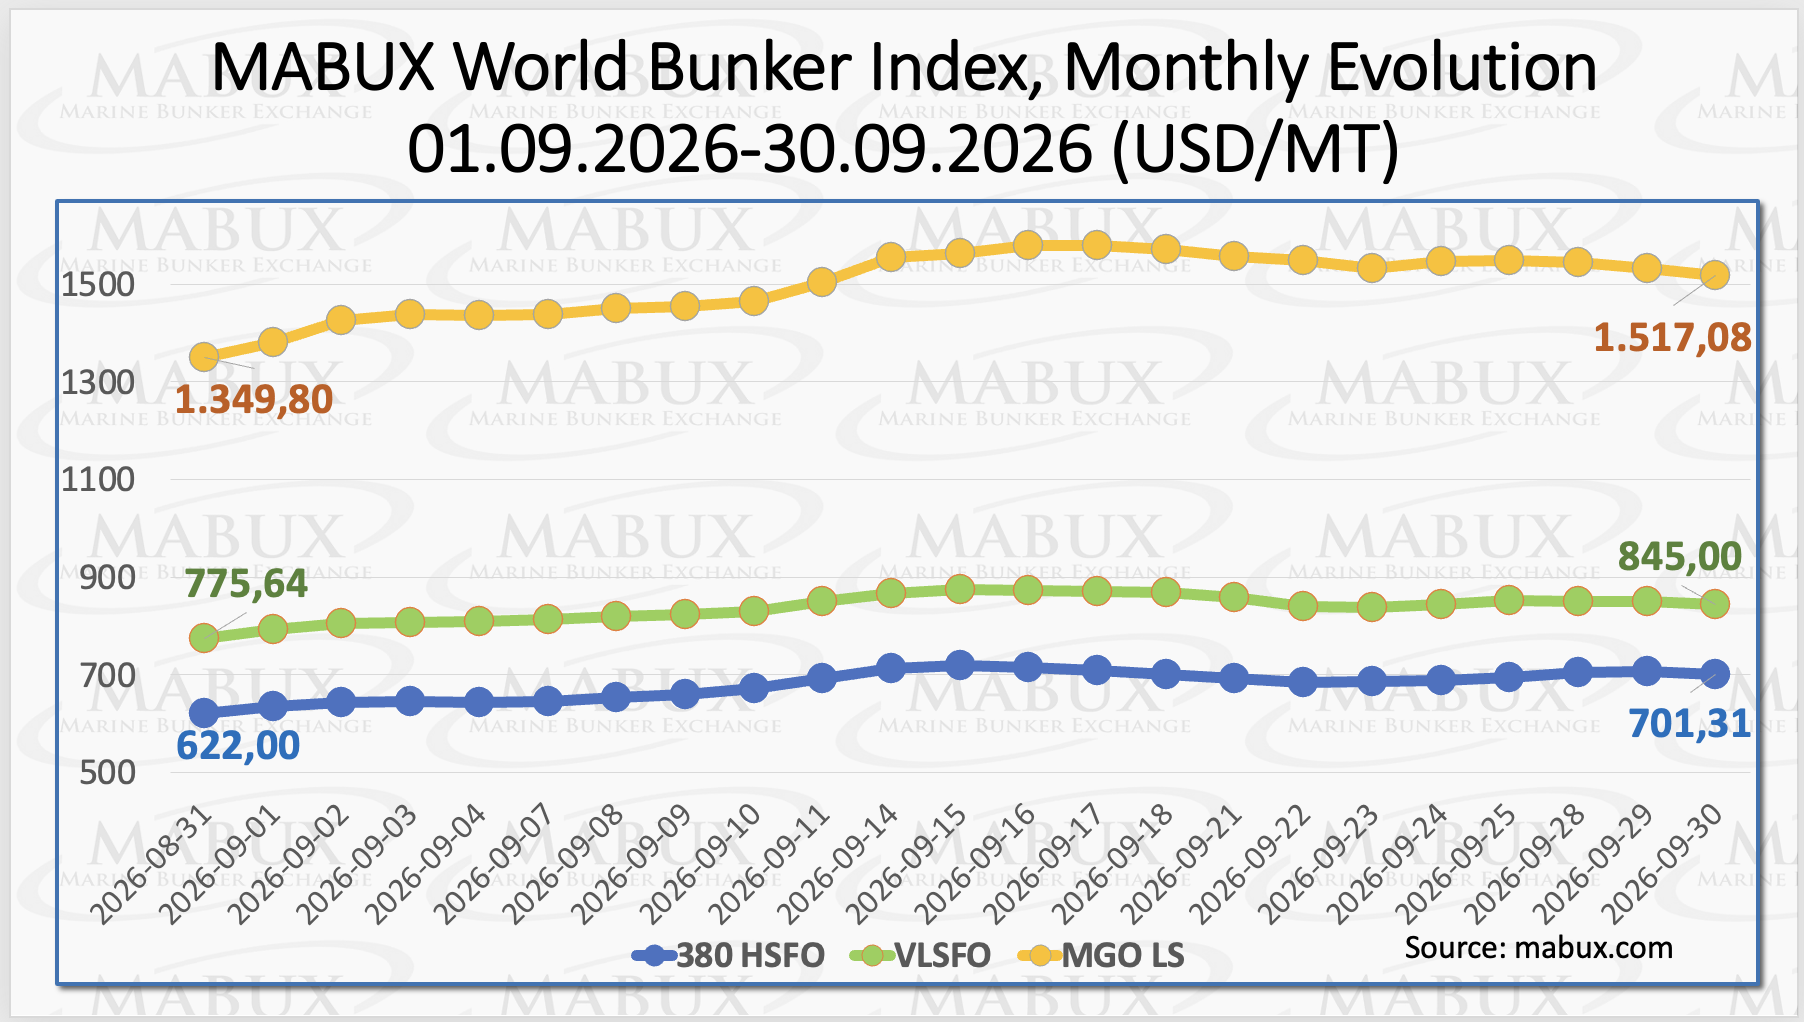
MABUX bunker fuel price index showing monthly changes in global bunker prices

Global bunker prices rise in September as Middle East tensions lift fuel markets

October 1, 2026
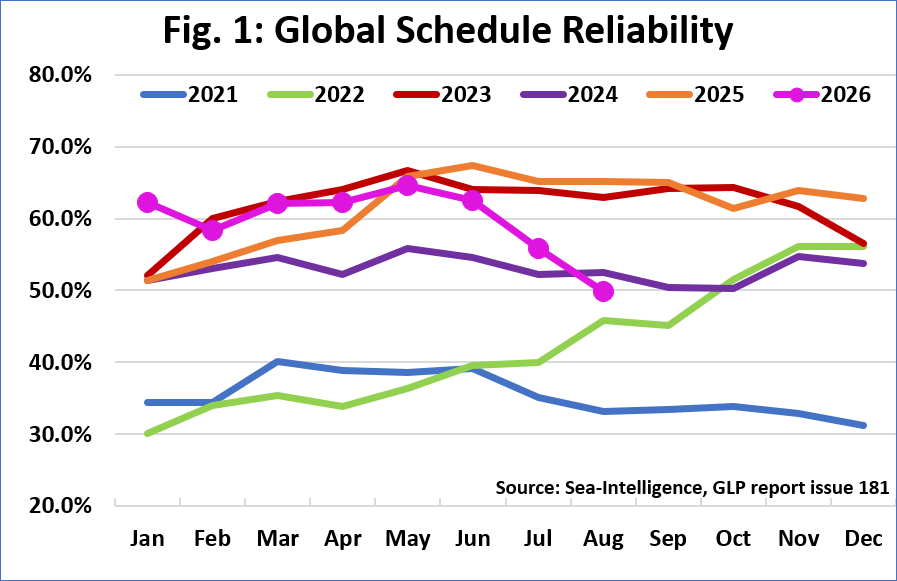
Global schedule reliability trends from 2021 to August 2026

Global schedule reliability drops below 50% in August

September 30, 2026
Trending Posts
bunker fuel prices

Global bunker fuel report – week 2

January 14, 2021
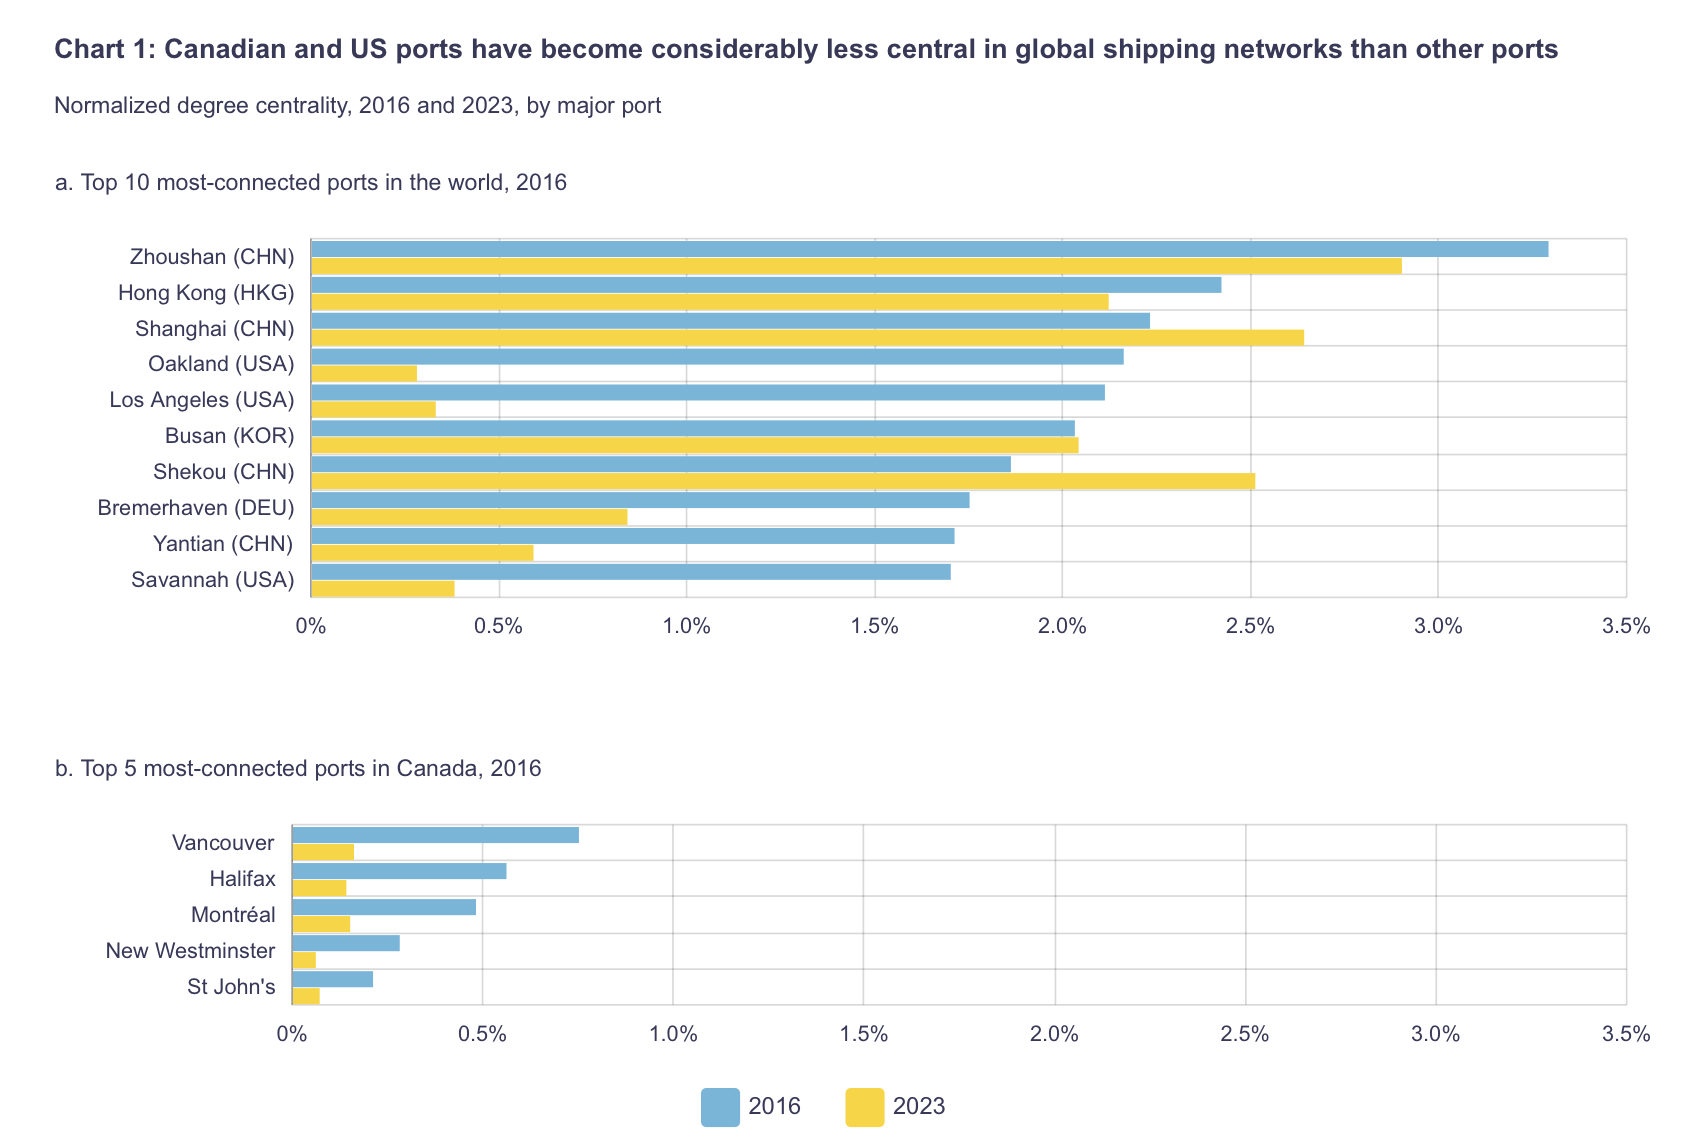
Horizontal bar chart comparing 2016 (blue) and 2023 (yellow) normalized degree centrality for the world's top 10 ports, showing Zhoushan highest, followed by Shanghai and Hong Kong; Canada section appears below with top 5 ports such as Vancouver, Halifax, Montréal, New Westminster, and St John's.

Canadian ports lose ground in global shipping networks

June 4, 2026
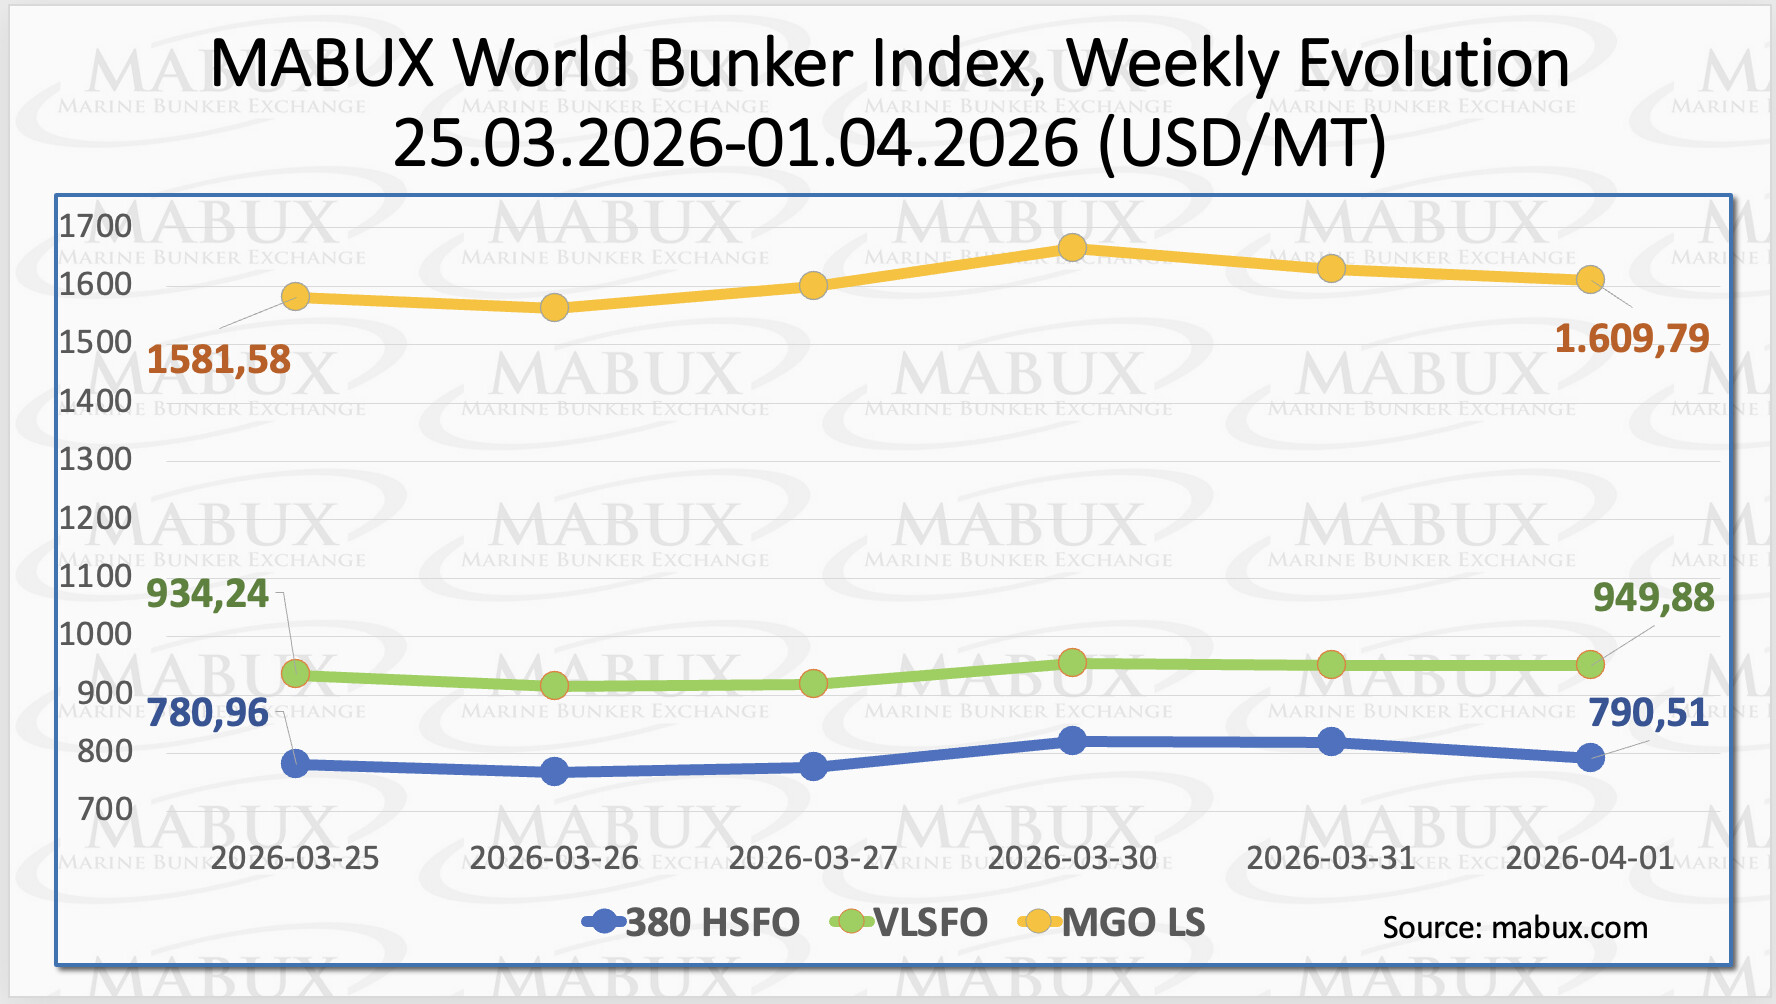
MABUX bunker fuel price index showing weekly changes in global bunker prices

Global bunker prices rise as Middle East tensions keep fuel markets volatile

April 2, 2026
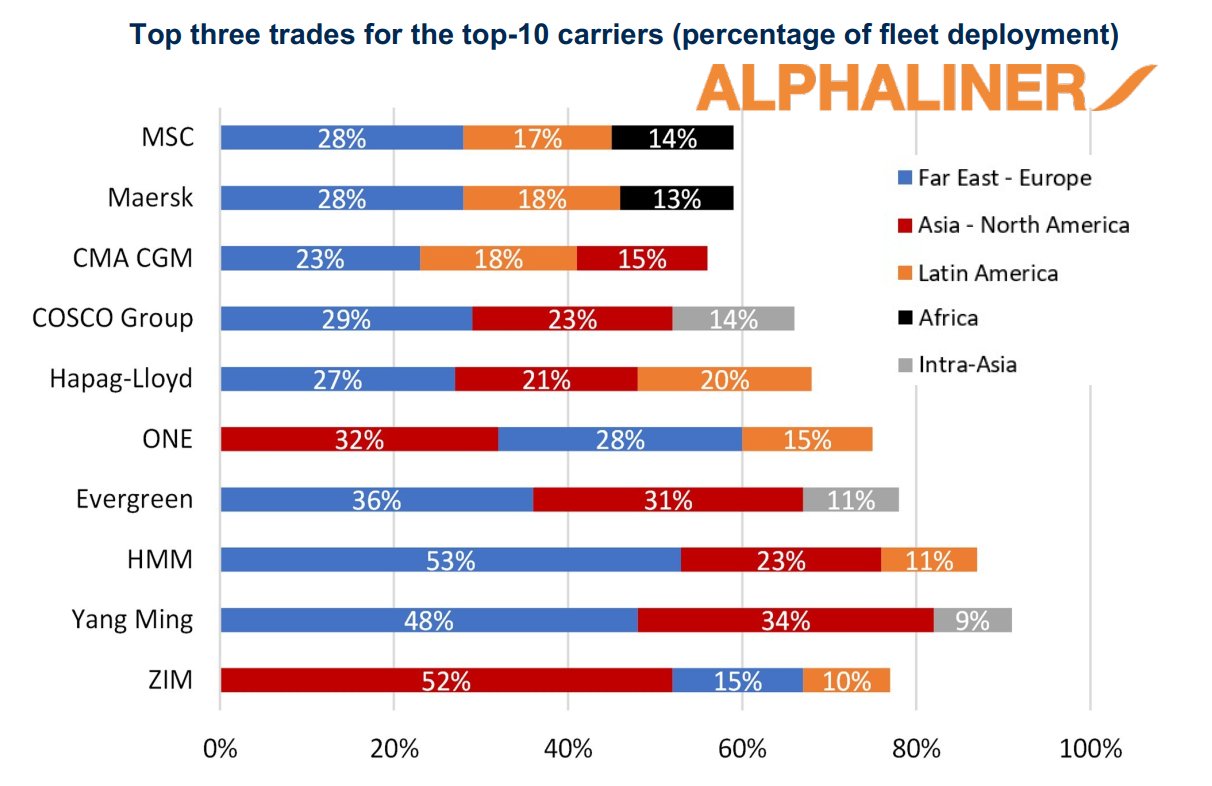
Horizontal stacked bar chart showing top-3 trades by region for 10 carriers, with percentage shares by Far East–Europe, Asia–N. America, Latin America, Africa, and intra-Asia colors labeled.

Container shipping portfolios differ between European and Asian carriers

July 2, 2026
Global-Maritime-Hub- Logo

Maritime market intelligence platform featuring 2,200+ reports, presentations and industry insights, with new content added every week. more info

Categories

  • Shipping Economic Trends & Regions
  • Ports & Terminals
  • Piracy & Security
  • Emissions, Fuel Technology & Environment
  • Economic Impact
  • Financing
  • Ship Building
  • Hinterland & Intermodal
  • Port Environmental Impact
  • Shipping Workforce

Recent Analysis

Shipping connectivity shifts amid geopolitical disruptions

Maersk share price outlook improves as market cap tops $50 billion

Global bunker prices rise in September as Middle East tensions lift fuel markets

Weekly Updates

Sign up to receive our weekly newsletter (each Thursday) with new shipping industry market reports, presentations & analysis.

Your subscription could not be saved. Please try again.
Your subscription has been successful.

By signing up, I agree to our TOS and Privacy Policy.

© 2026 GlobalMaritimeHub | All Rights Reserved

X-twitter Linkedin Youtube