Skip to content
Global-Maritime-Hub- Logo
X-twitter Linkedin Youtube
  • Home
  • Premium Content
  • Insights
  • Events
  • Industry Links
    • Broker
    • Certification
    • Consultant
    • Industry Association
    • Institute & Think Tank
    • Legal Experts
    • Official Institution / Body
    • Port & Port Authority
    • Recruitment Specialist
    • Research & Market Data
    • Shipping Company
    • Industry Blog
    • Trade Media
    • Training & Education
  • About Us
  • Other Hubs
    • GLOBAL LNG HUB
    • EUROPEAN GAS HUB
    • THE COAL HUB
    • GLOBAL HYDROGEN HUB
    • GLOBAL MINERALS HUB
  • FREE TRIAL
  • My account
  • Login
  • Home
  • Premium Content
  • Insights
  • Events
  • Industry Links
    • Broker
    • Certification
    • Consultant
    • Industry Association
    • Institute & Think Tank
    • Legal Experts
    • Official Institution / Body
    • Port & Port Authority
    • Recruitment Specialist
    • Research & Market Data
    • Shipping Company
    • Industry Blog
    • Trade Media
    • Training & Education
  • About Us
  • Other Hubs
    • GLOBAL LNG HUB
    • EUROPEAN GAS HUB
    • THE COAL HUB
    • GLOBAL HYDROGEN HUB
    • GLOBAL MINERALS HUB
  • FREE TRIAL
  • My account
  • Login
€0.00 0 Cart
Global-Maritime-Hub- Logo
€0.00 0 Cart
  • Home
  • Premium Content
  • Insights
  • Events
  • Industry Links
    • Broker
    • Certification
    • Consultant
    • Industry Association
    • Institute & Think Tank
    • Legal Experts
    • Official Institution / Body
    • Port & Port Authority
    • Recruitment Specialist
    • Research & Market Data
    • Shipping Company
    • Industry Blog
    • Trade Media
    • Training & Education
  • About Us
  • Other Hubs
    • GLOBAL LNG HUB
    • EUROPEAN GAS HUB
    • THE COAL HUB
    • GLOBAL HYDROGEN HUB
    • GLOBAL MINERALS HUB
  • FREE TRIAL
  • My account
  • Login
X-twitter Linkedin Youtube

© 2025 GlobalMaritimeHub | All Rights Reserved

Author: David Callanan

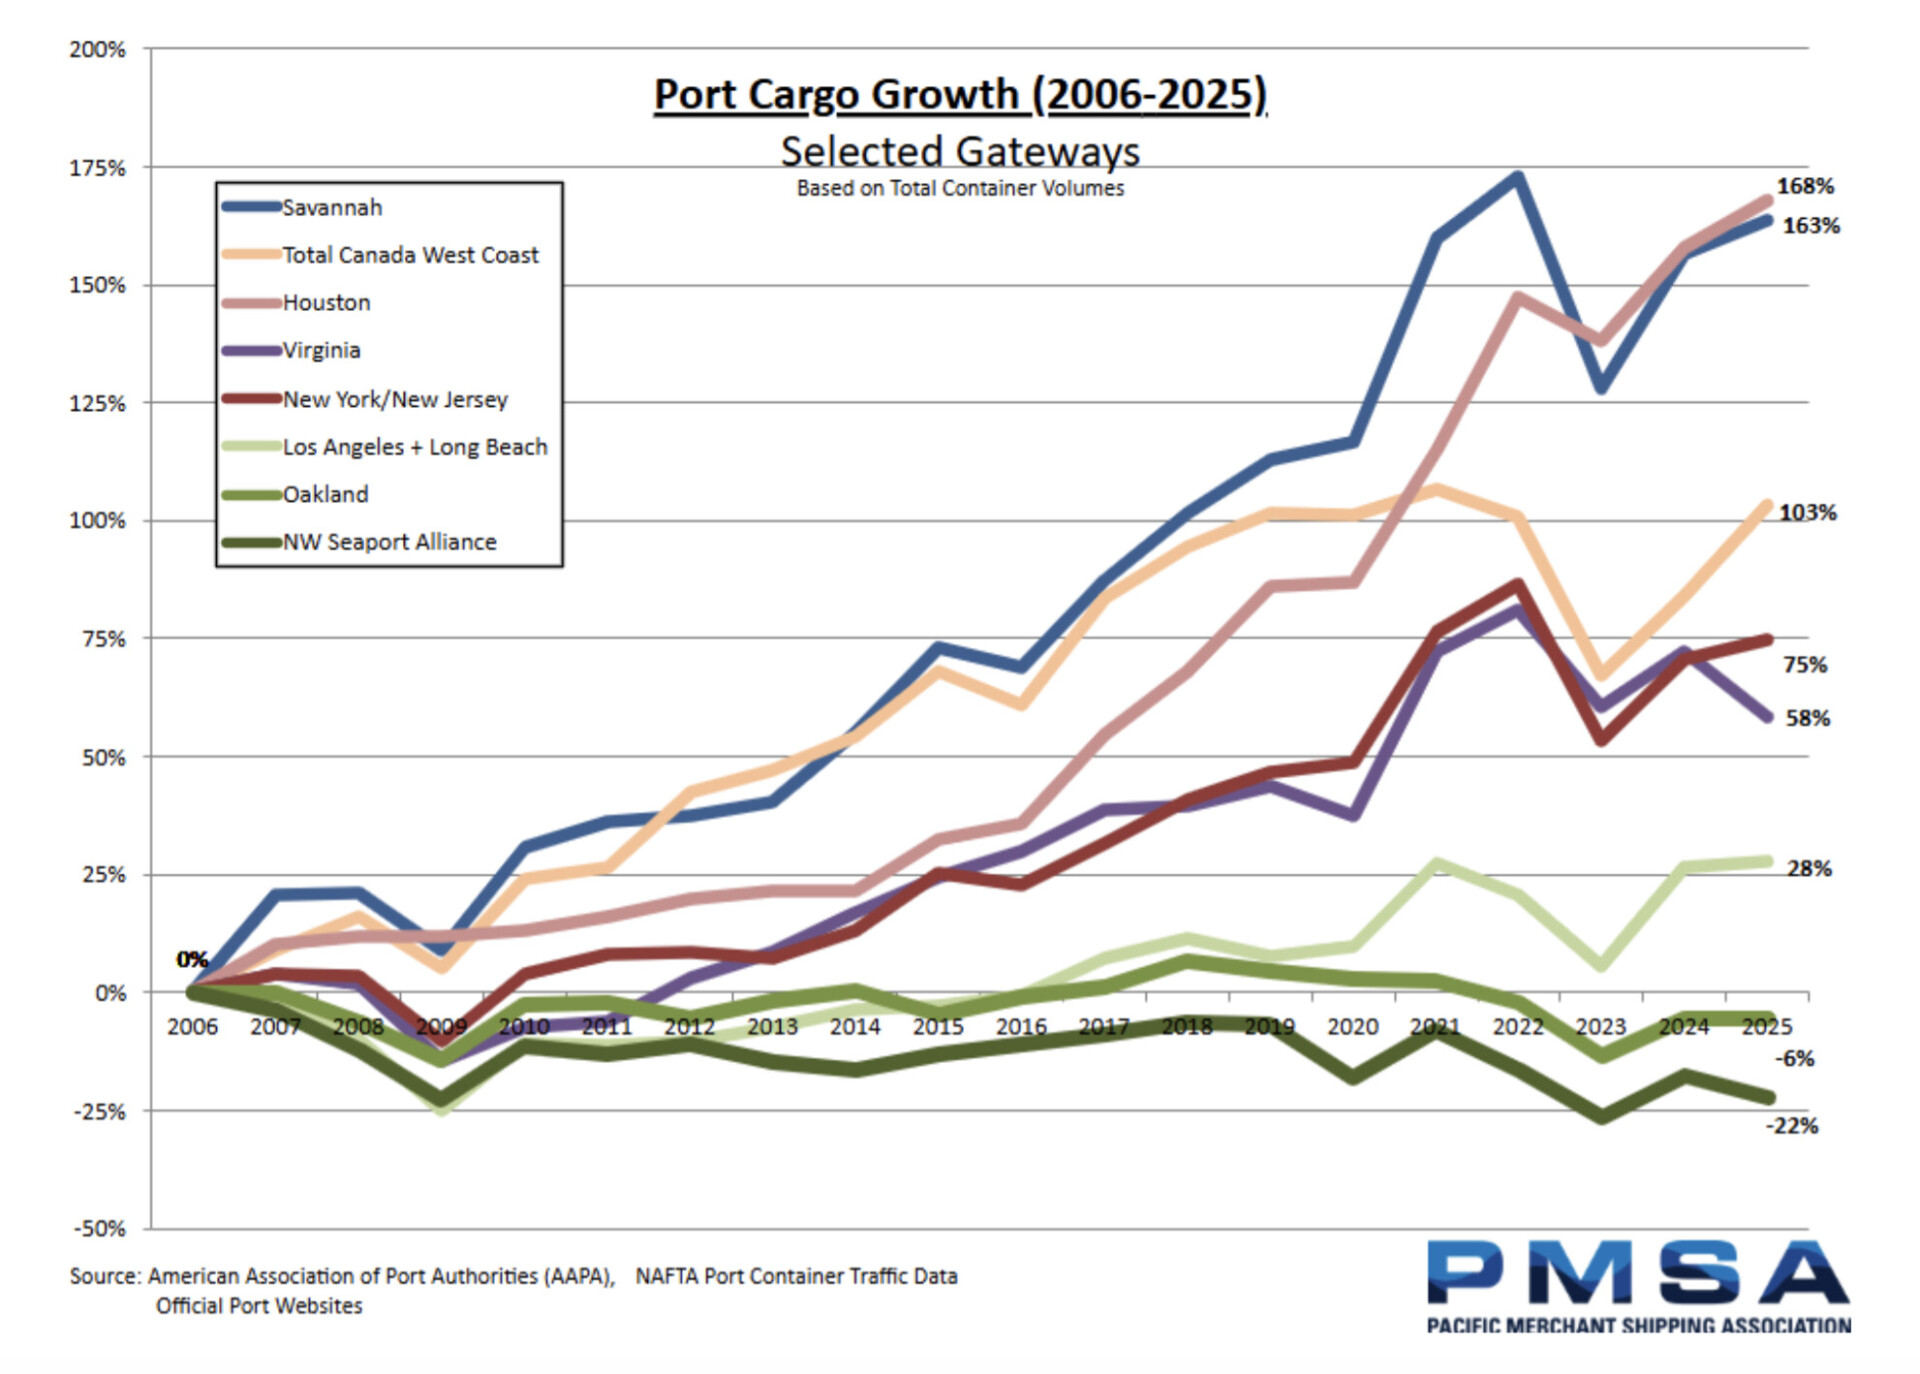
Line chart of Port Cargo Growth (2006–2025) for selected gateways, showing multiple port lines and end values around 168% for Savannah, 163% for NY/NJ, 103% for West Coast, and 58% for others. Note: based on total container volumes.

US West Coast ports regain momentum but face long road to market share recovery

  • May 15, 2026
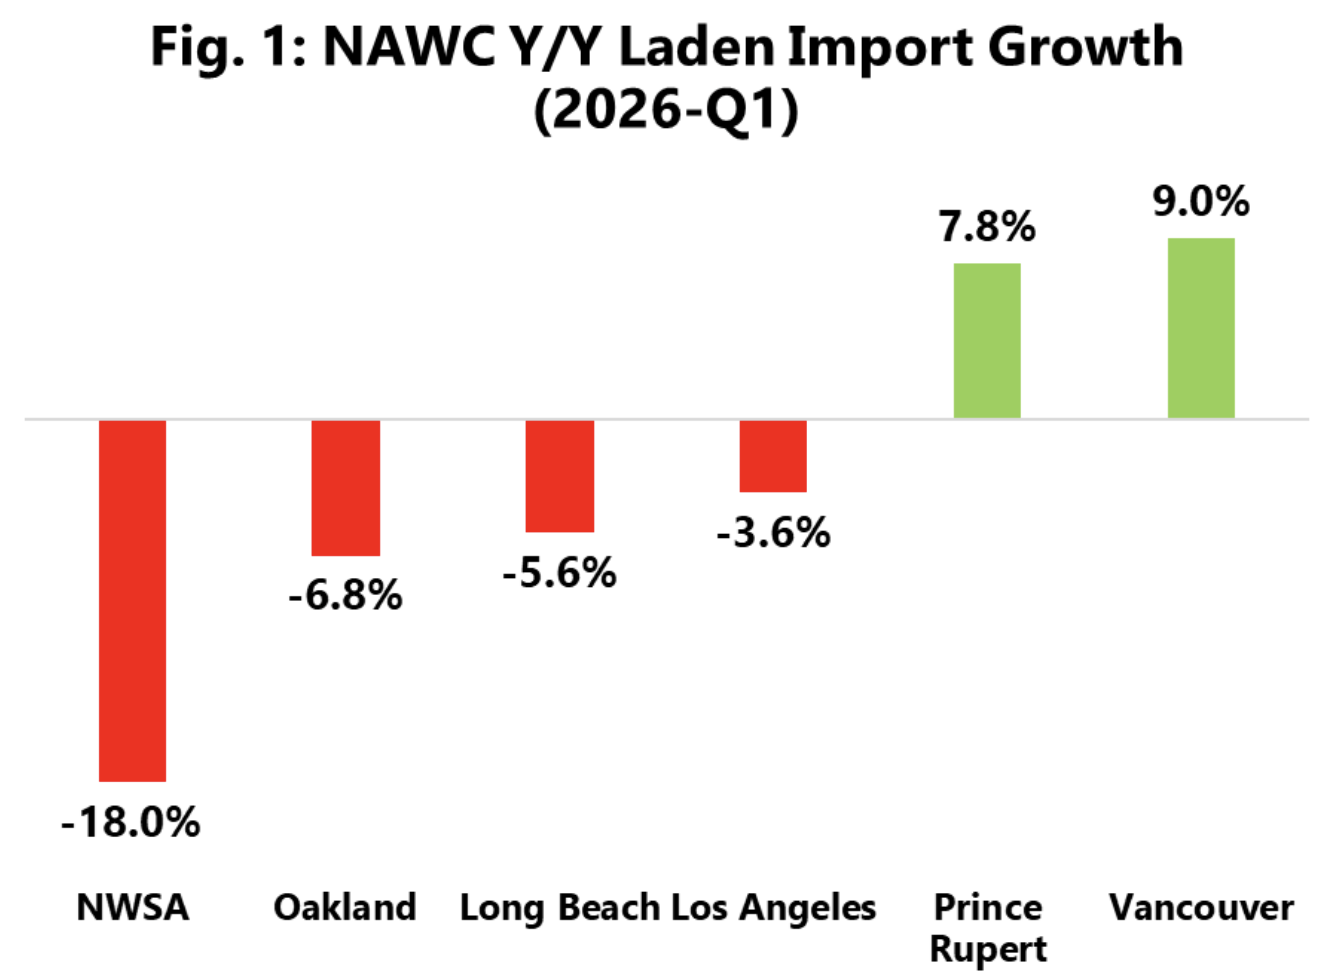
Bar chart of 2026-Q1 NAWC Laden Import Growth by port; shows declines at NWSA (-18%), Oakland (-6.8%), Long Beach (-5.6%), LA (-3.6%), and gains at Prince Rupert (7.8%), Vancouver (9%).

Transpacific container trade shifts north as Canadian ports gain market share

  • May 15, 2026
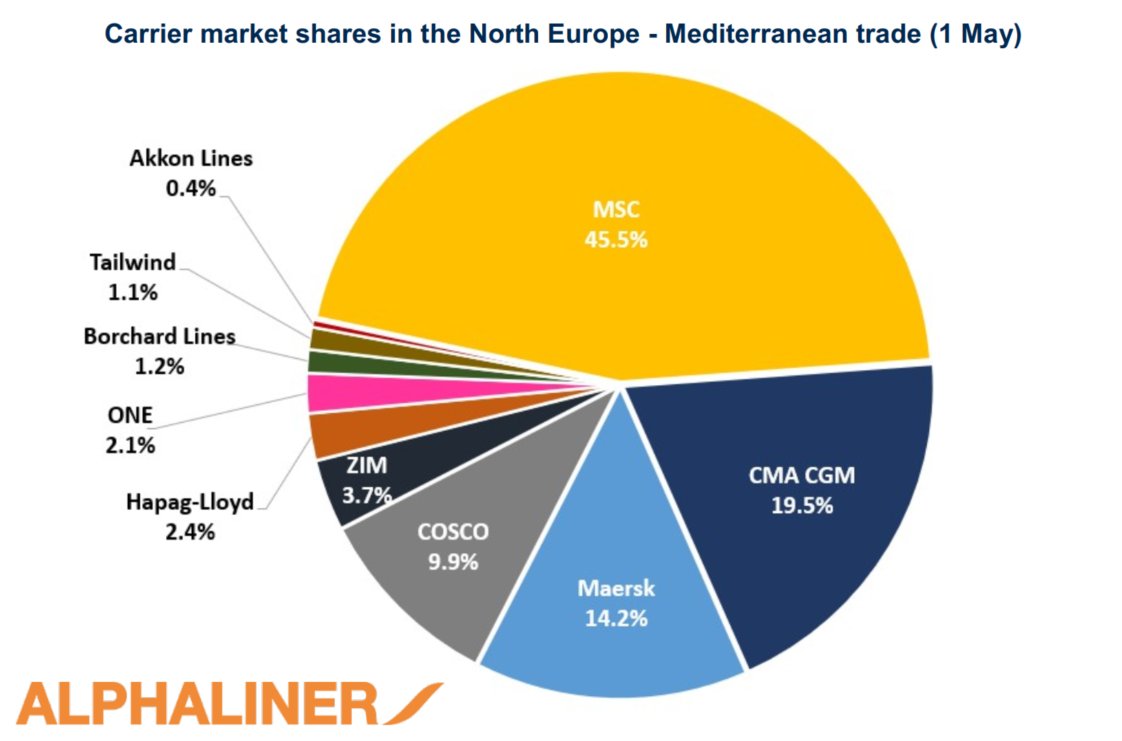
Pie chart showing carrier market shares in the North Europe–Mediterranean trade with MSC holding 45.5% capacity share

MSC leads North Europe–Med container shipping market

  • May 14, 2026
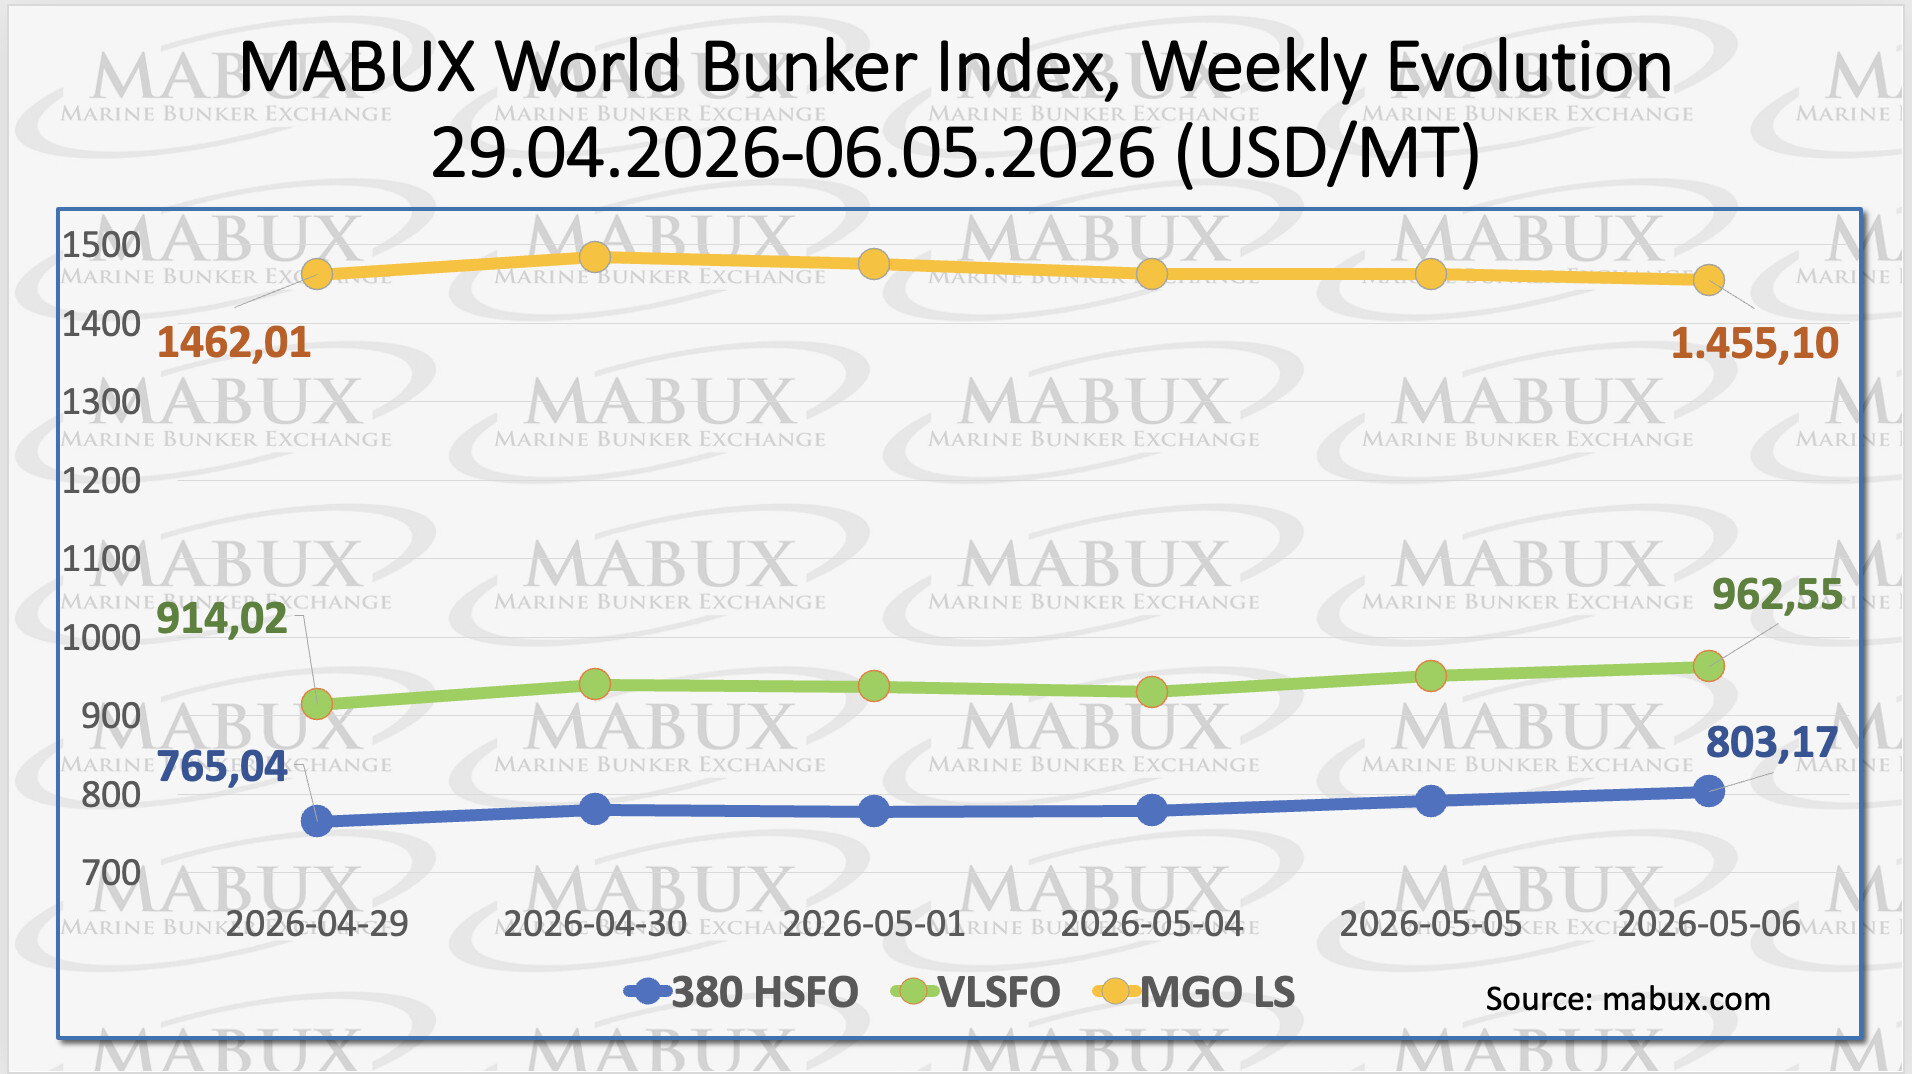
MABUX bunker fuel price index chart showing weekly changes in global bunker prices for HSFO, VLSFO and MGO LS during Week 20 2026

Global bunker prices remain volatile as Middle East tensions persist

  • May 14, 2026
MABUX bunker fuel price index showing weekly changes in global bunker prices for HSFO, VLSFO and MGO LS

Global bunker prices rise amid mixed marine fuel market trends

  • May 7, 2026
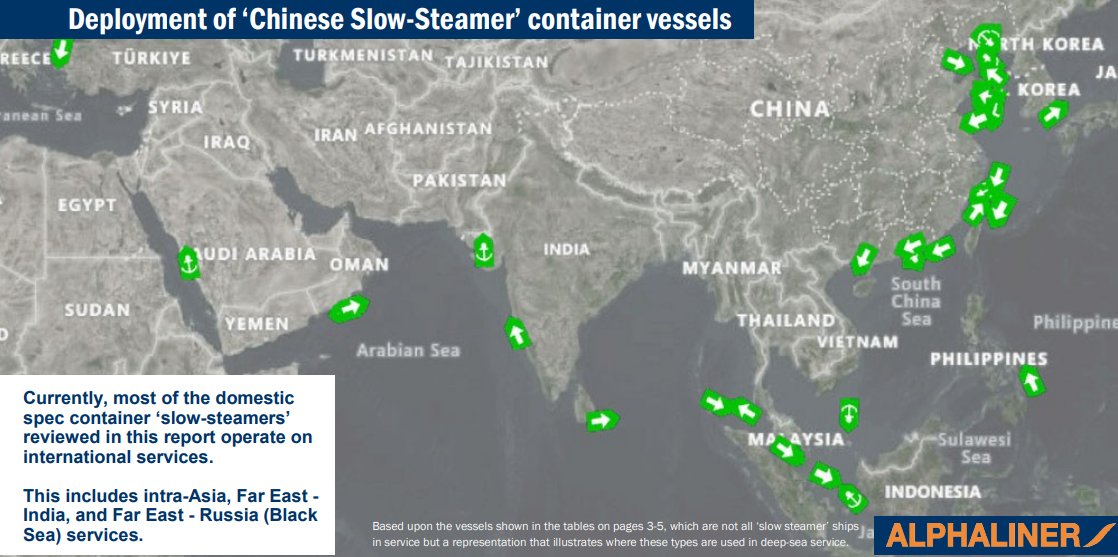
Map titled 'Deployment of Chinese Slow-Steamer container vessels' showing green ship icons across the Indian Ocean, Red Sea, and East Asia for vessel deployments.

Chinese container ships emerge as charter market stars

  • May 7, 2026
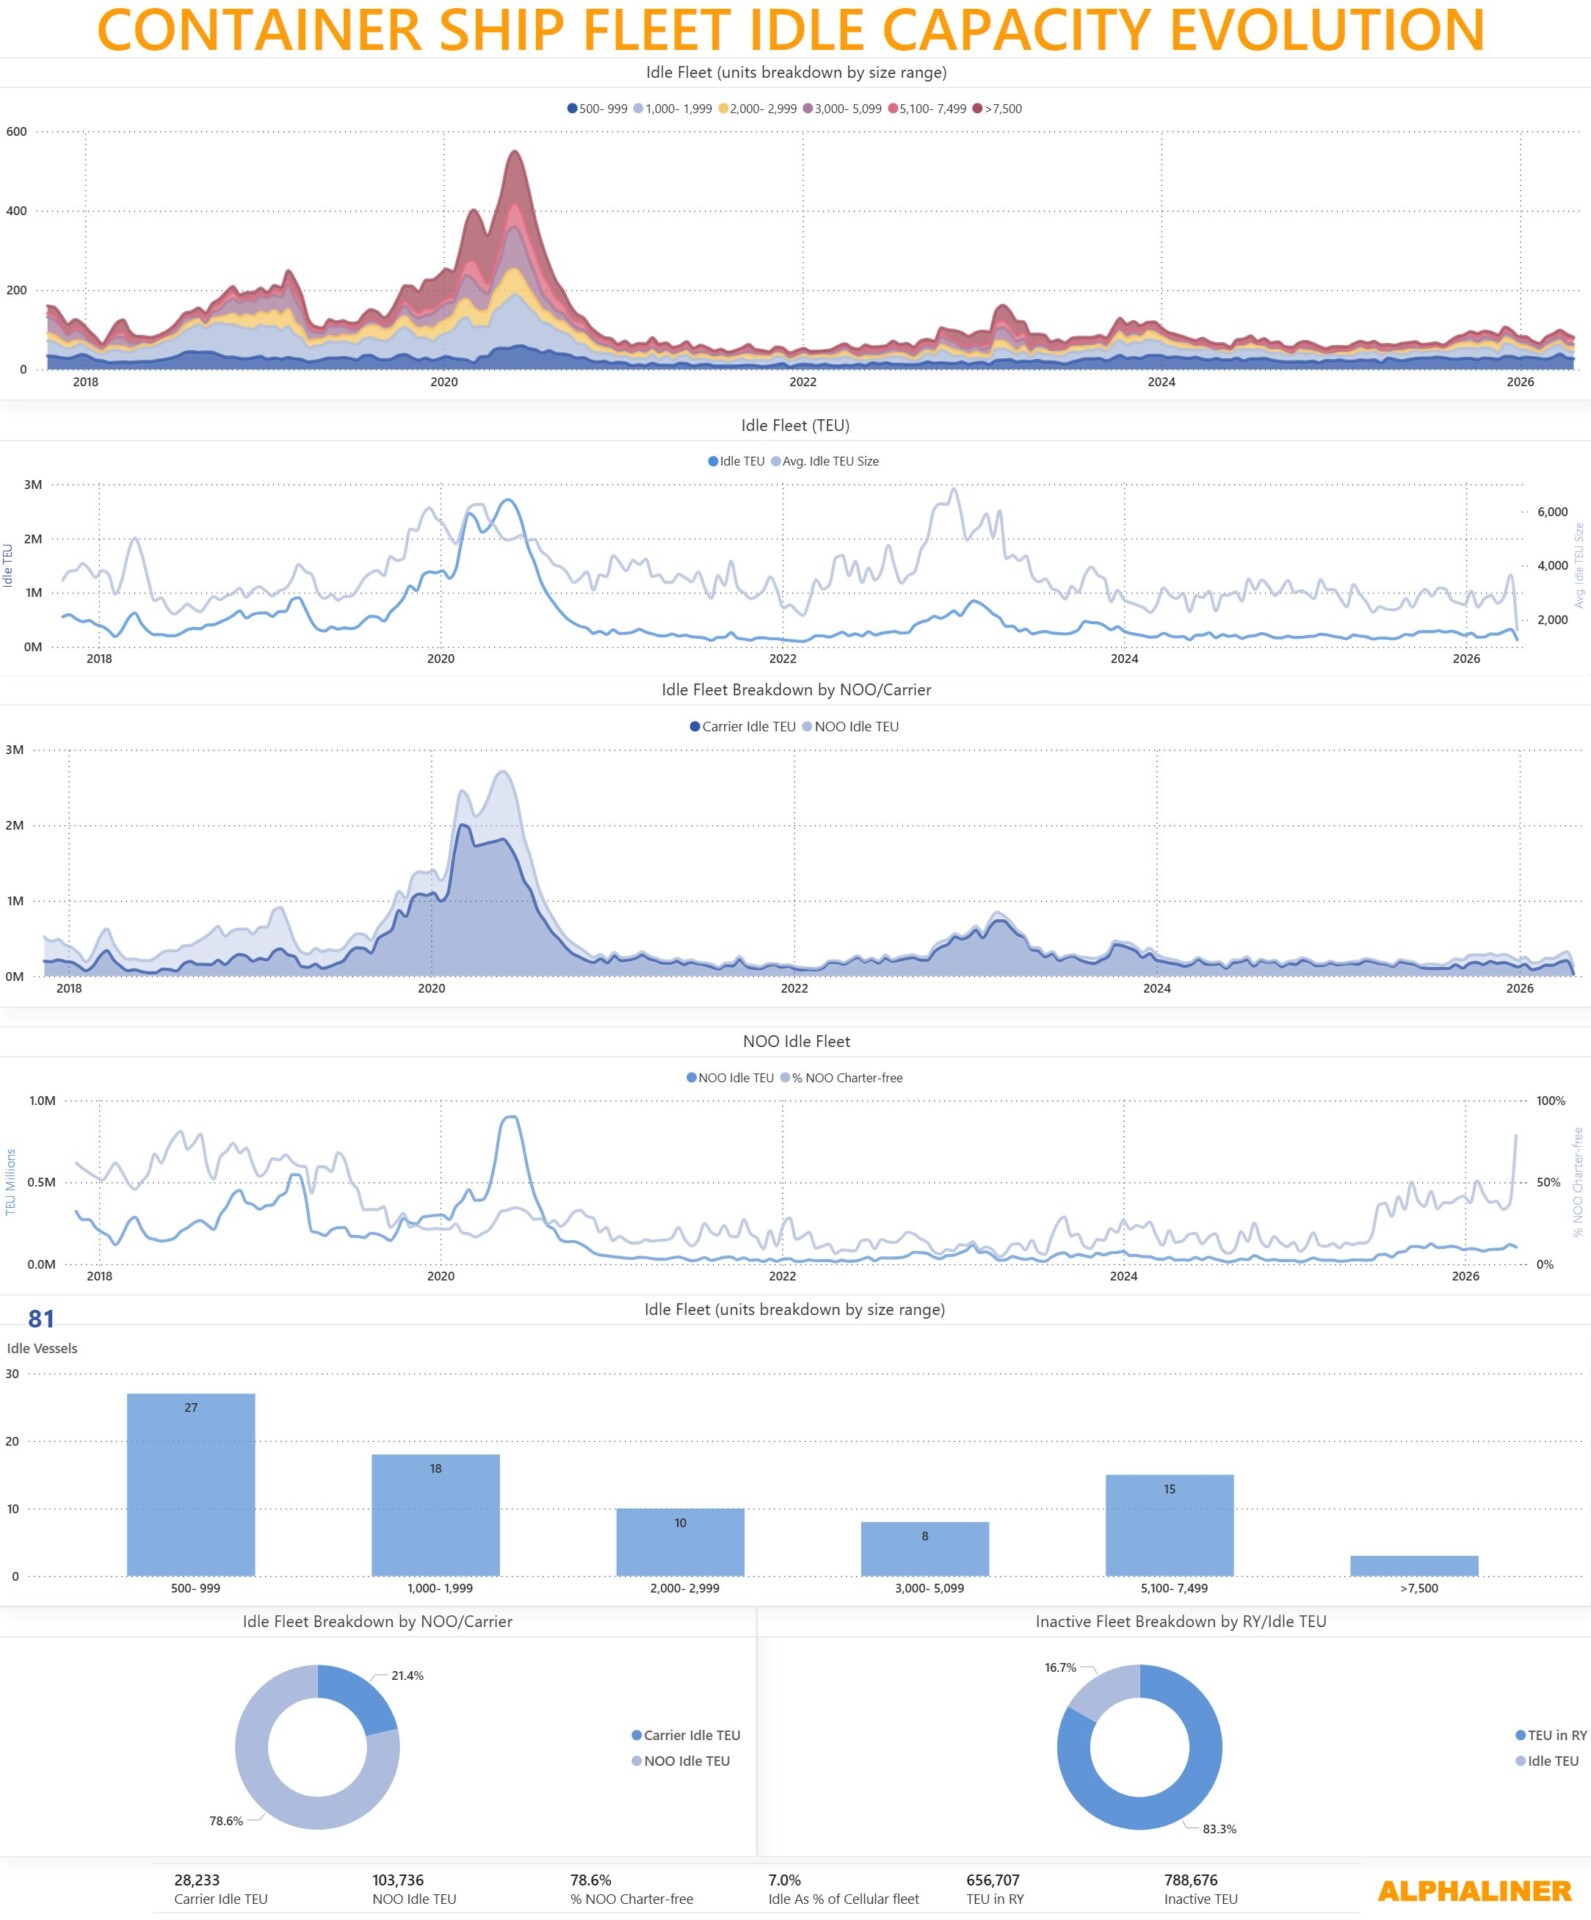
Charts showing the evolution of global container ship idle capacity, idle fleet TEU levels, and vessel breakdown by size range in 2025.

Gulf conflict keeps container tonnage supply tight

  • May 7, 2026
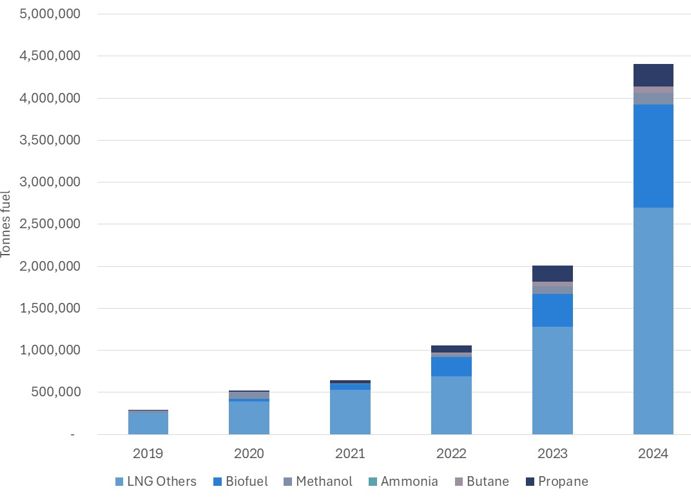
Bar chart showing increase in alternative marine fuel consumption from 2019 to 2024, led by LNG, biofuels, methanol, and LPG components

IMO MEPC 84 maritime fuel regulations: impact on LNG, biofuels & global shipping

  • April 30, 2026
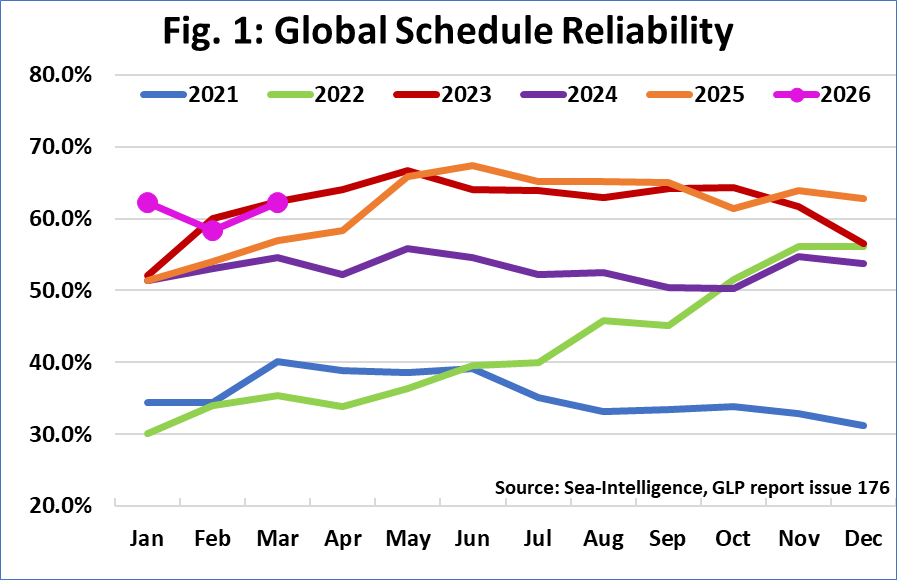
Line chart showing global container shipping reliability from 2021 to 2026 with monthly performance trends

Container shipping reliability rebounds as global schedules stabilise

  • April 30, 2026
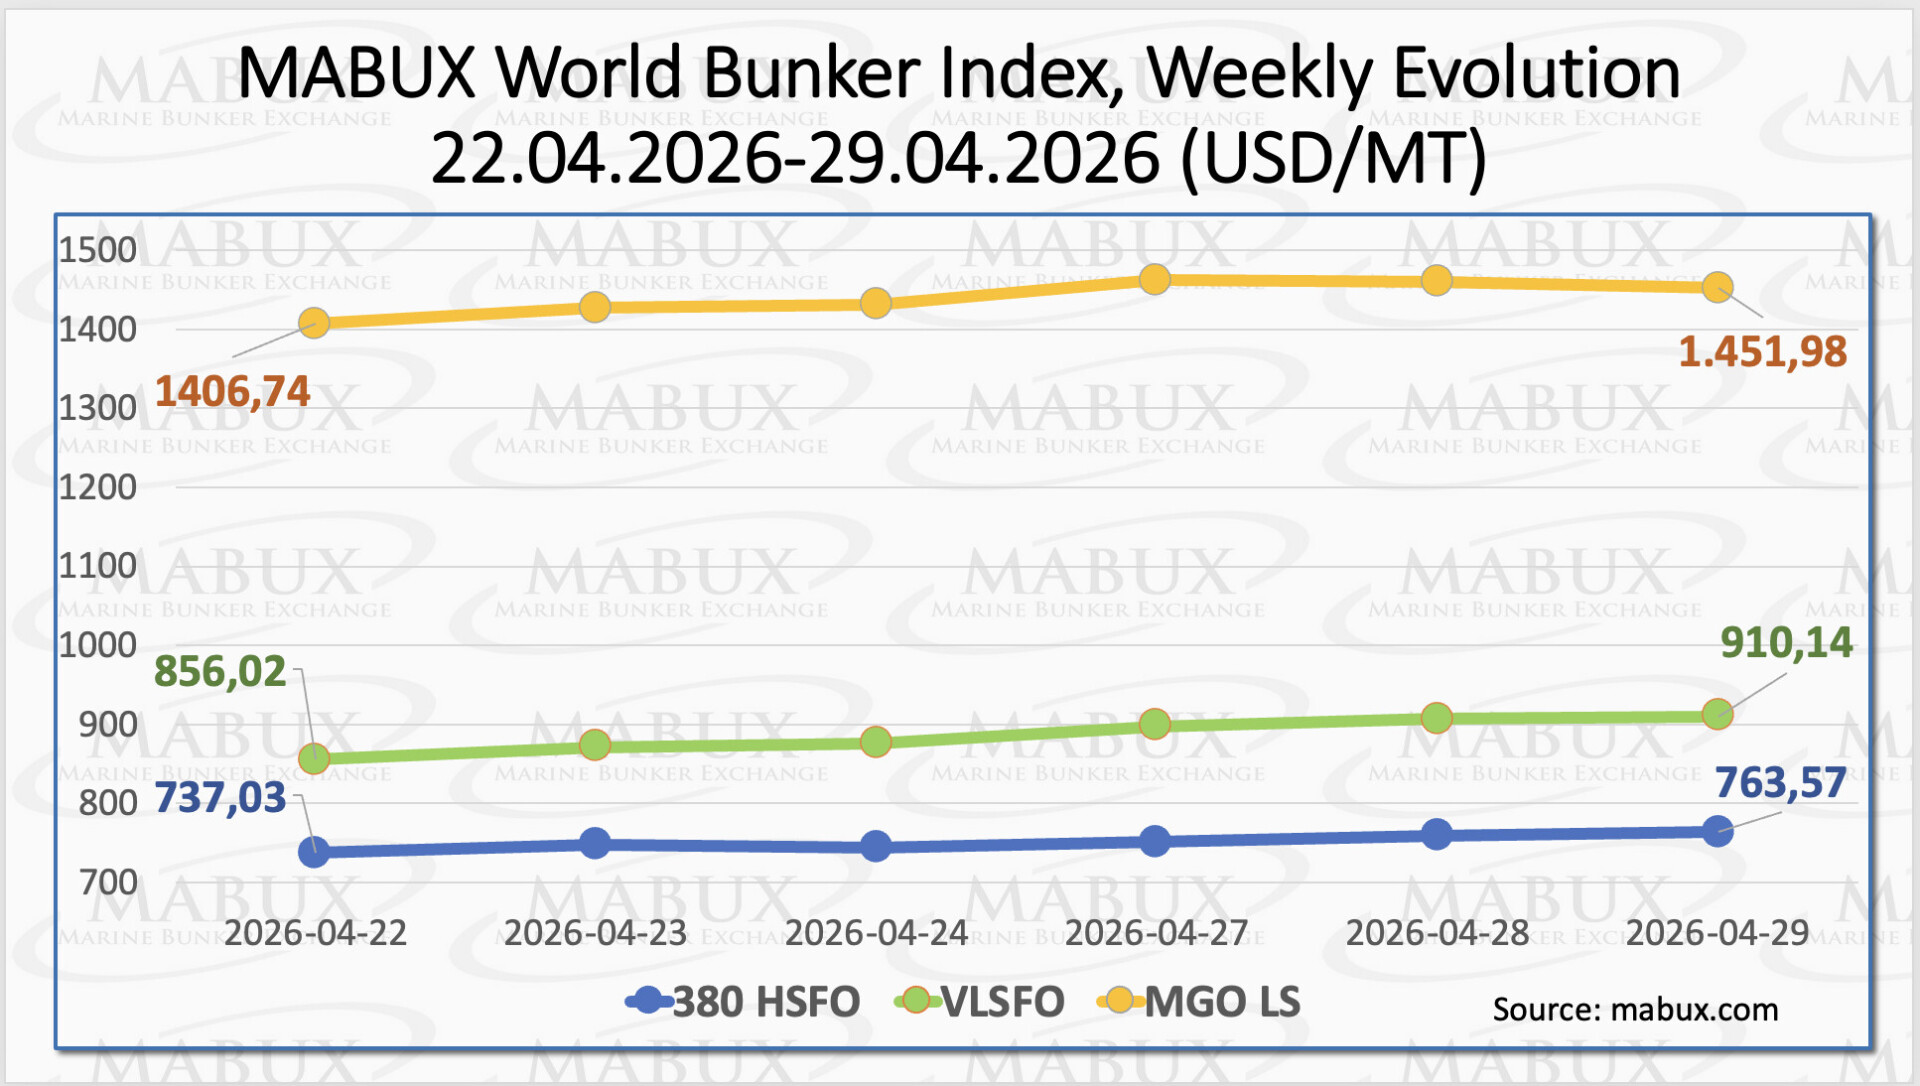
MABUX bunker fuel price index showing weekly changes in global bunker prices for HSFO, VLSFO and MGO LS

Global bunker prices rise as Middle East tensions support fuel markets

  • April 30, 2026
Previous Page1 … Page5 Page6 Page7 Page8 Page9 … Page84 Next
Recent Post
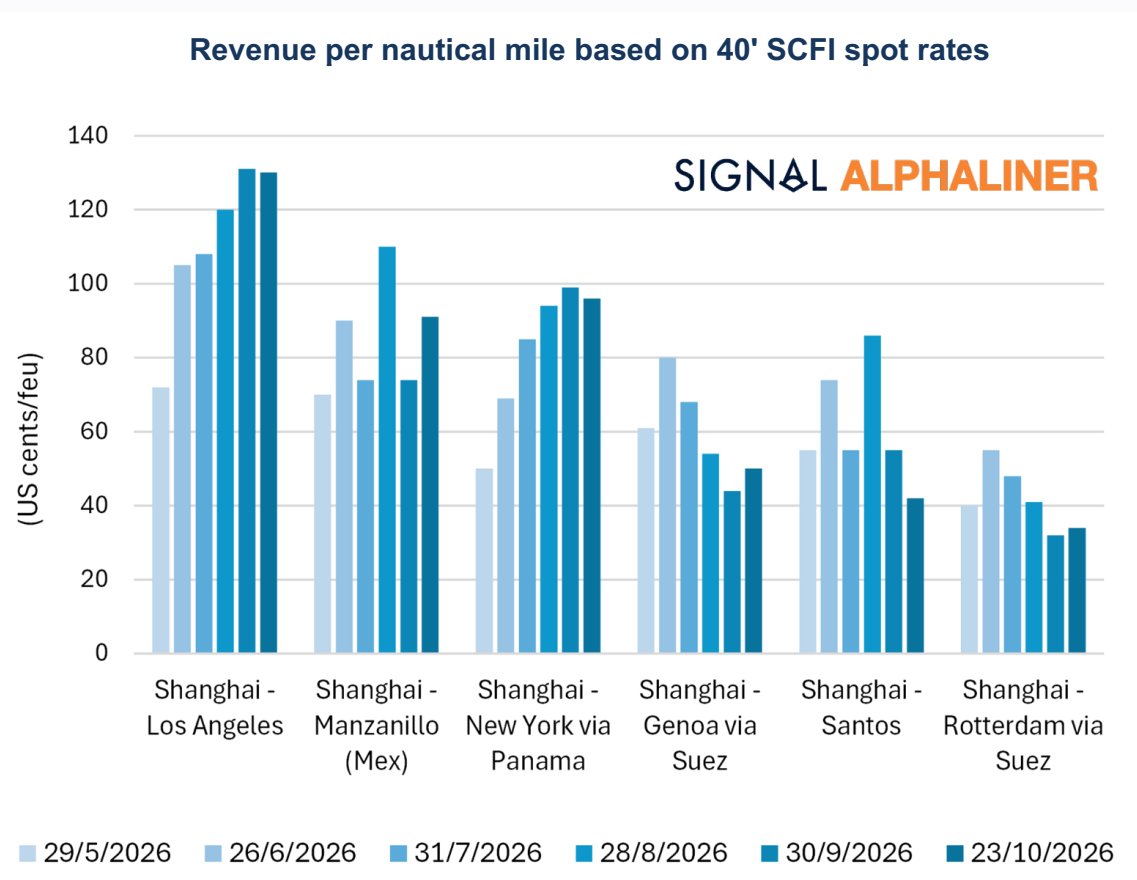
Alphaliner chart comparing revenue per nautical mile based on 40-foot SCFI spot rates across major Shanghai export routes in 2026.

Transpacific spot rates make China–US West Coast the most lucrative major trade

November 9, 2026
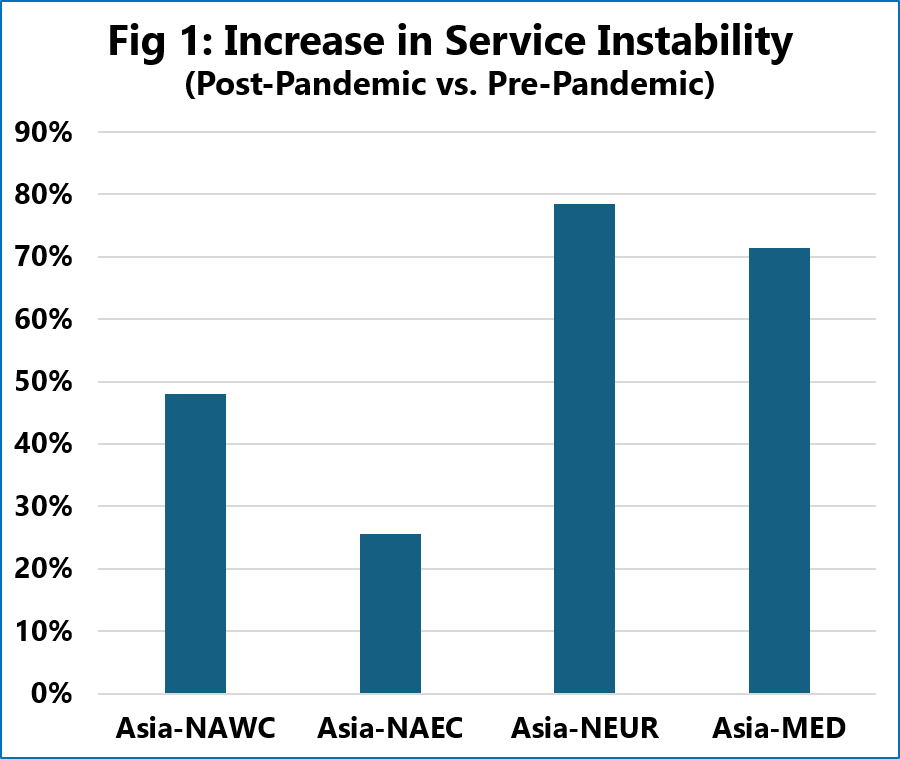
Increase in weekly liner service instability across Asia-Europe and Transpacific trade lanes after the pandemic

Liner service instability rises sharply on major trade lanes

November 9, 2026
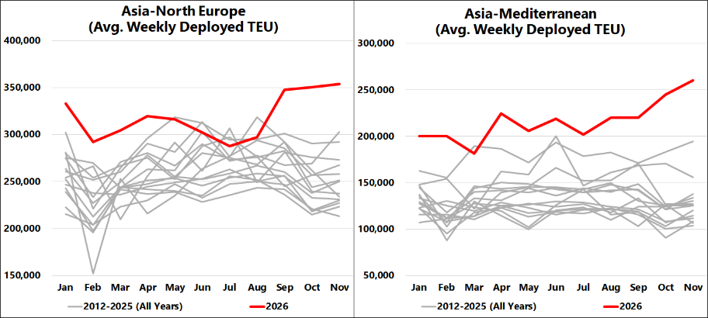
Average weekly deployed container capacity on Asia-North Europe and Asia-Mediterranean trade lanes in 2026

Asia-Europe container capacity reaches unprecedented levels

November 3, 2026
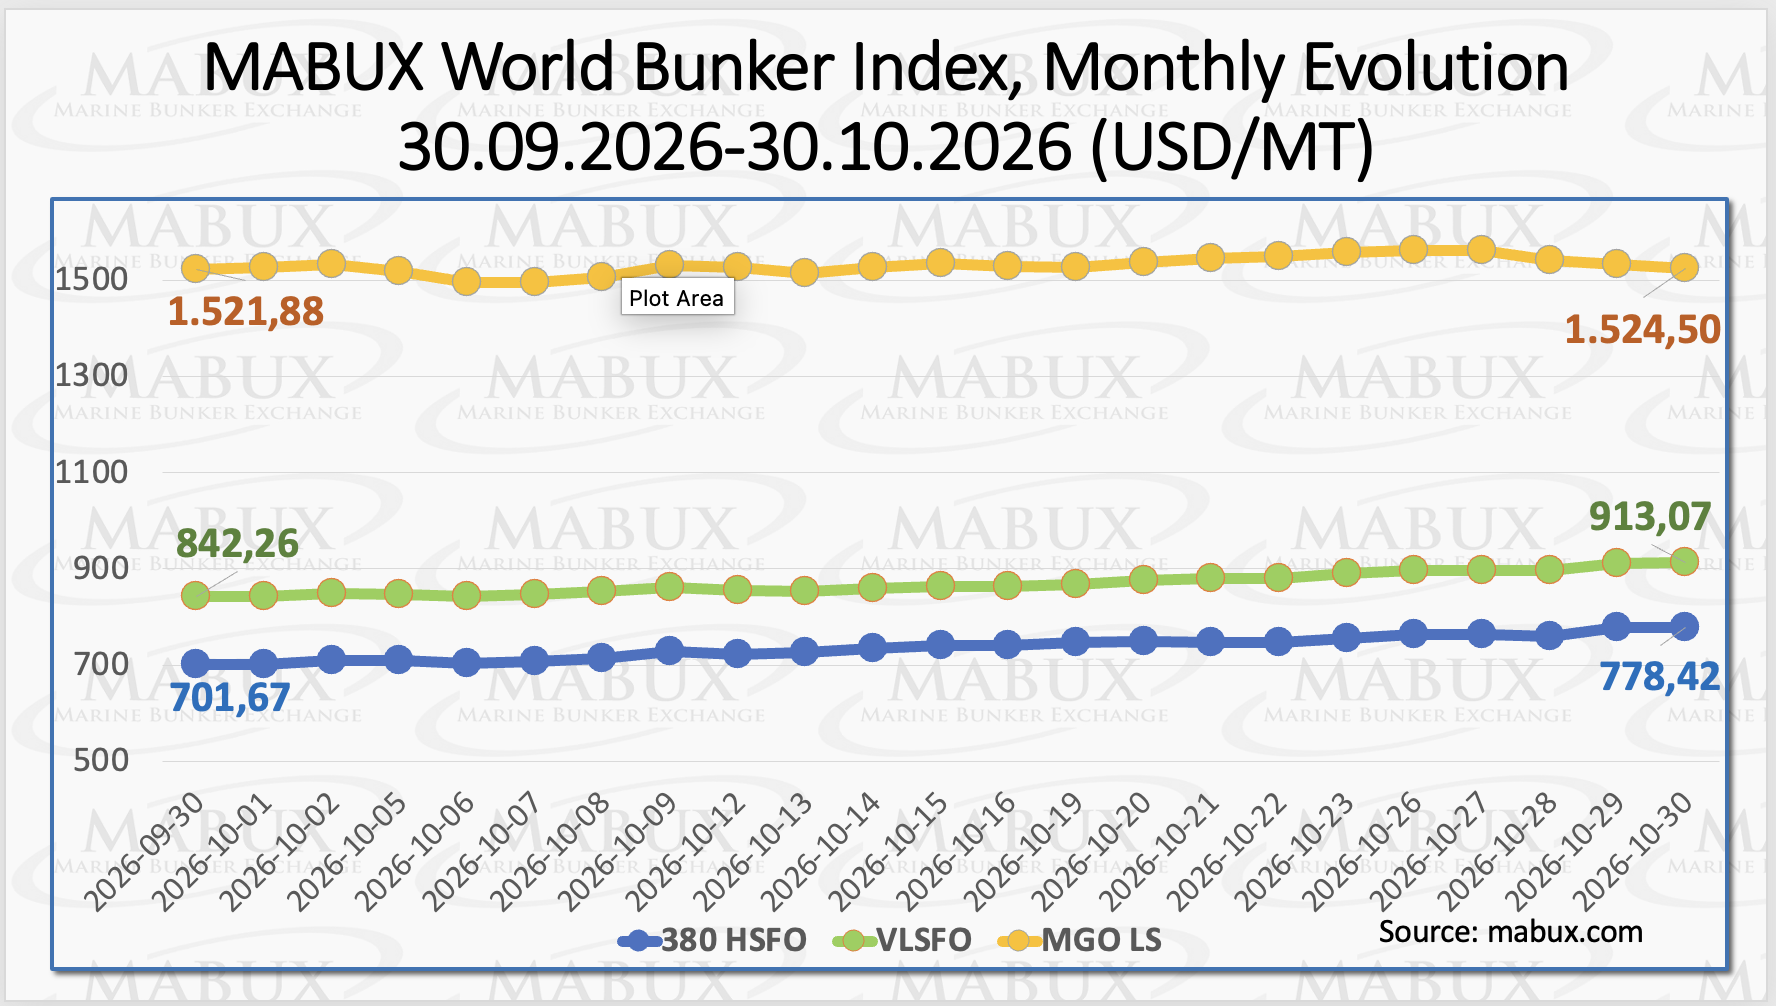
MABUX chart showing global bunker prices for HSFO, VLSFO and MGO LS in October 2026

Global bunker prices rise in October amid Middle East tensions and supply constraints

November 2, 2026
Trending Posts
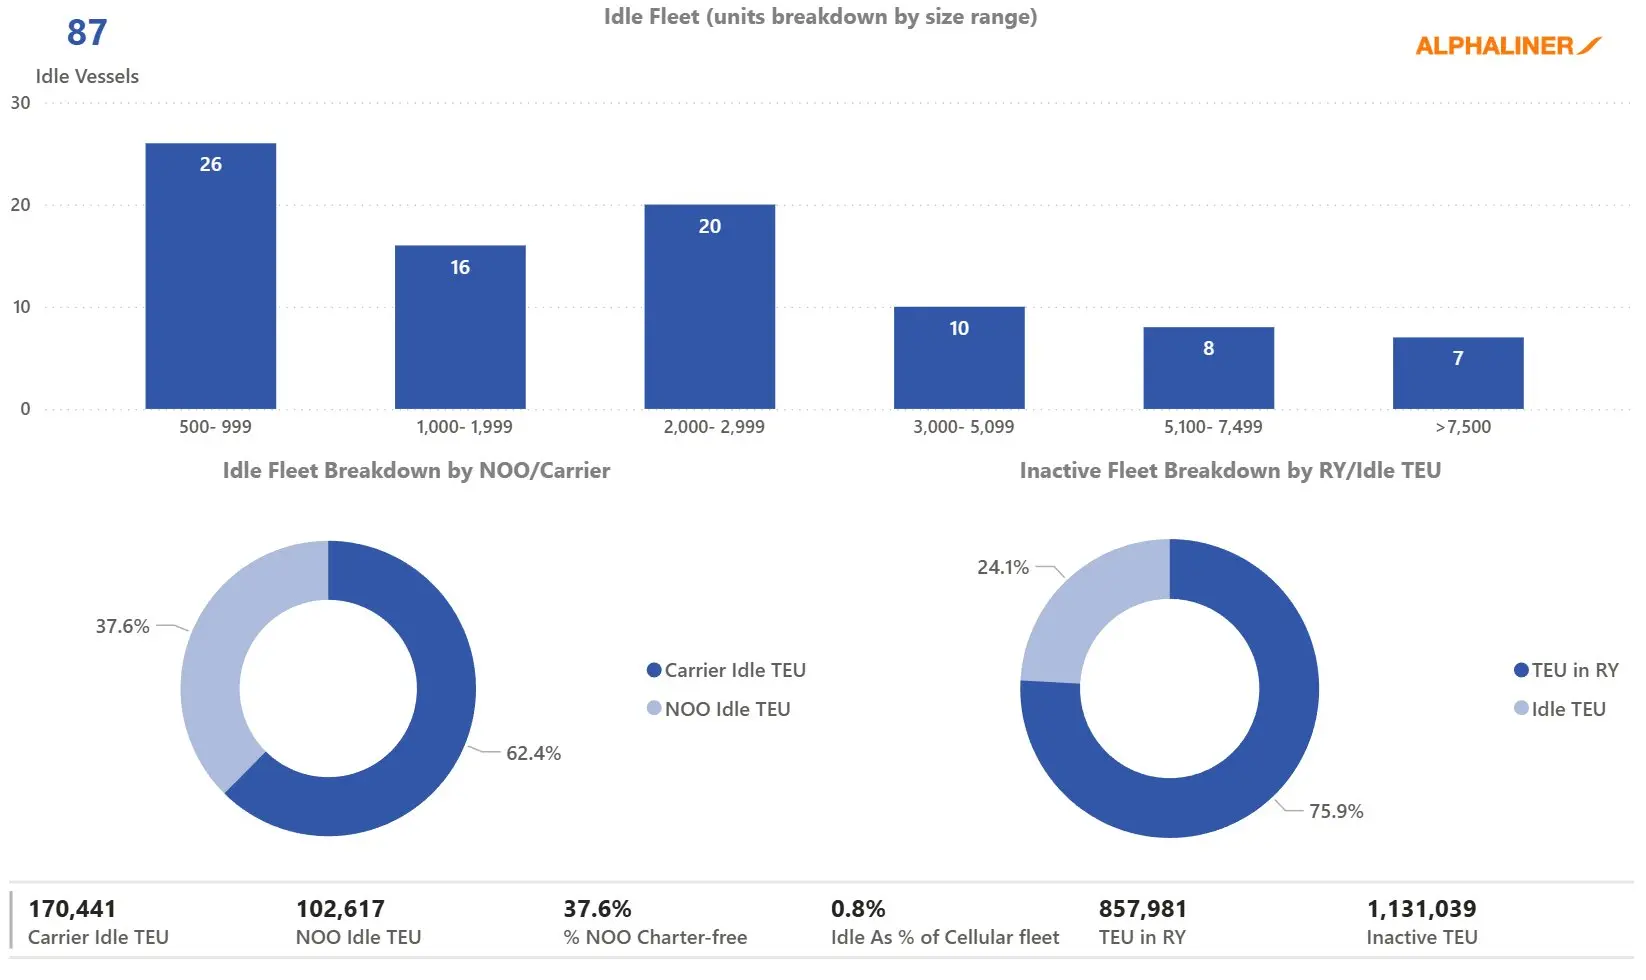
Idle container shipping fleet by size range and operator type.

Idle container shipping capacity drops again despite softer rates

November 28, 2025
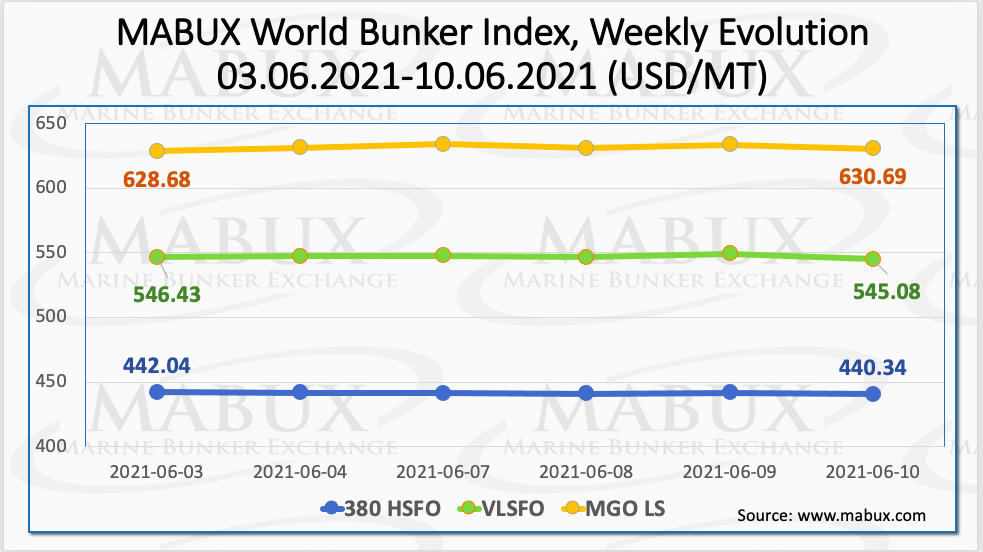
Bunker prices

Bunker Prices Weekly Outlook – Week 23

June 17, 2021
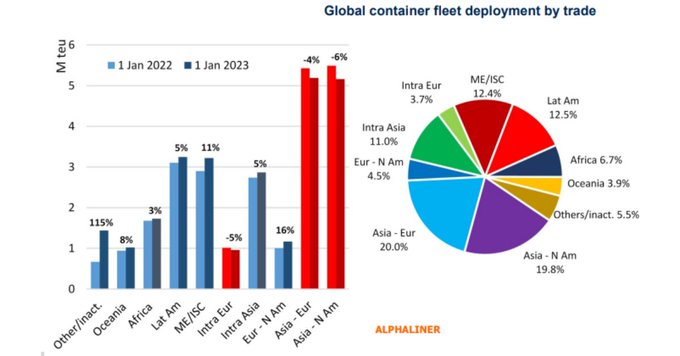
Carriers-shift-tonnage

Carriers shift tonnage to Middle East and India related loops

February 2, 2023
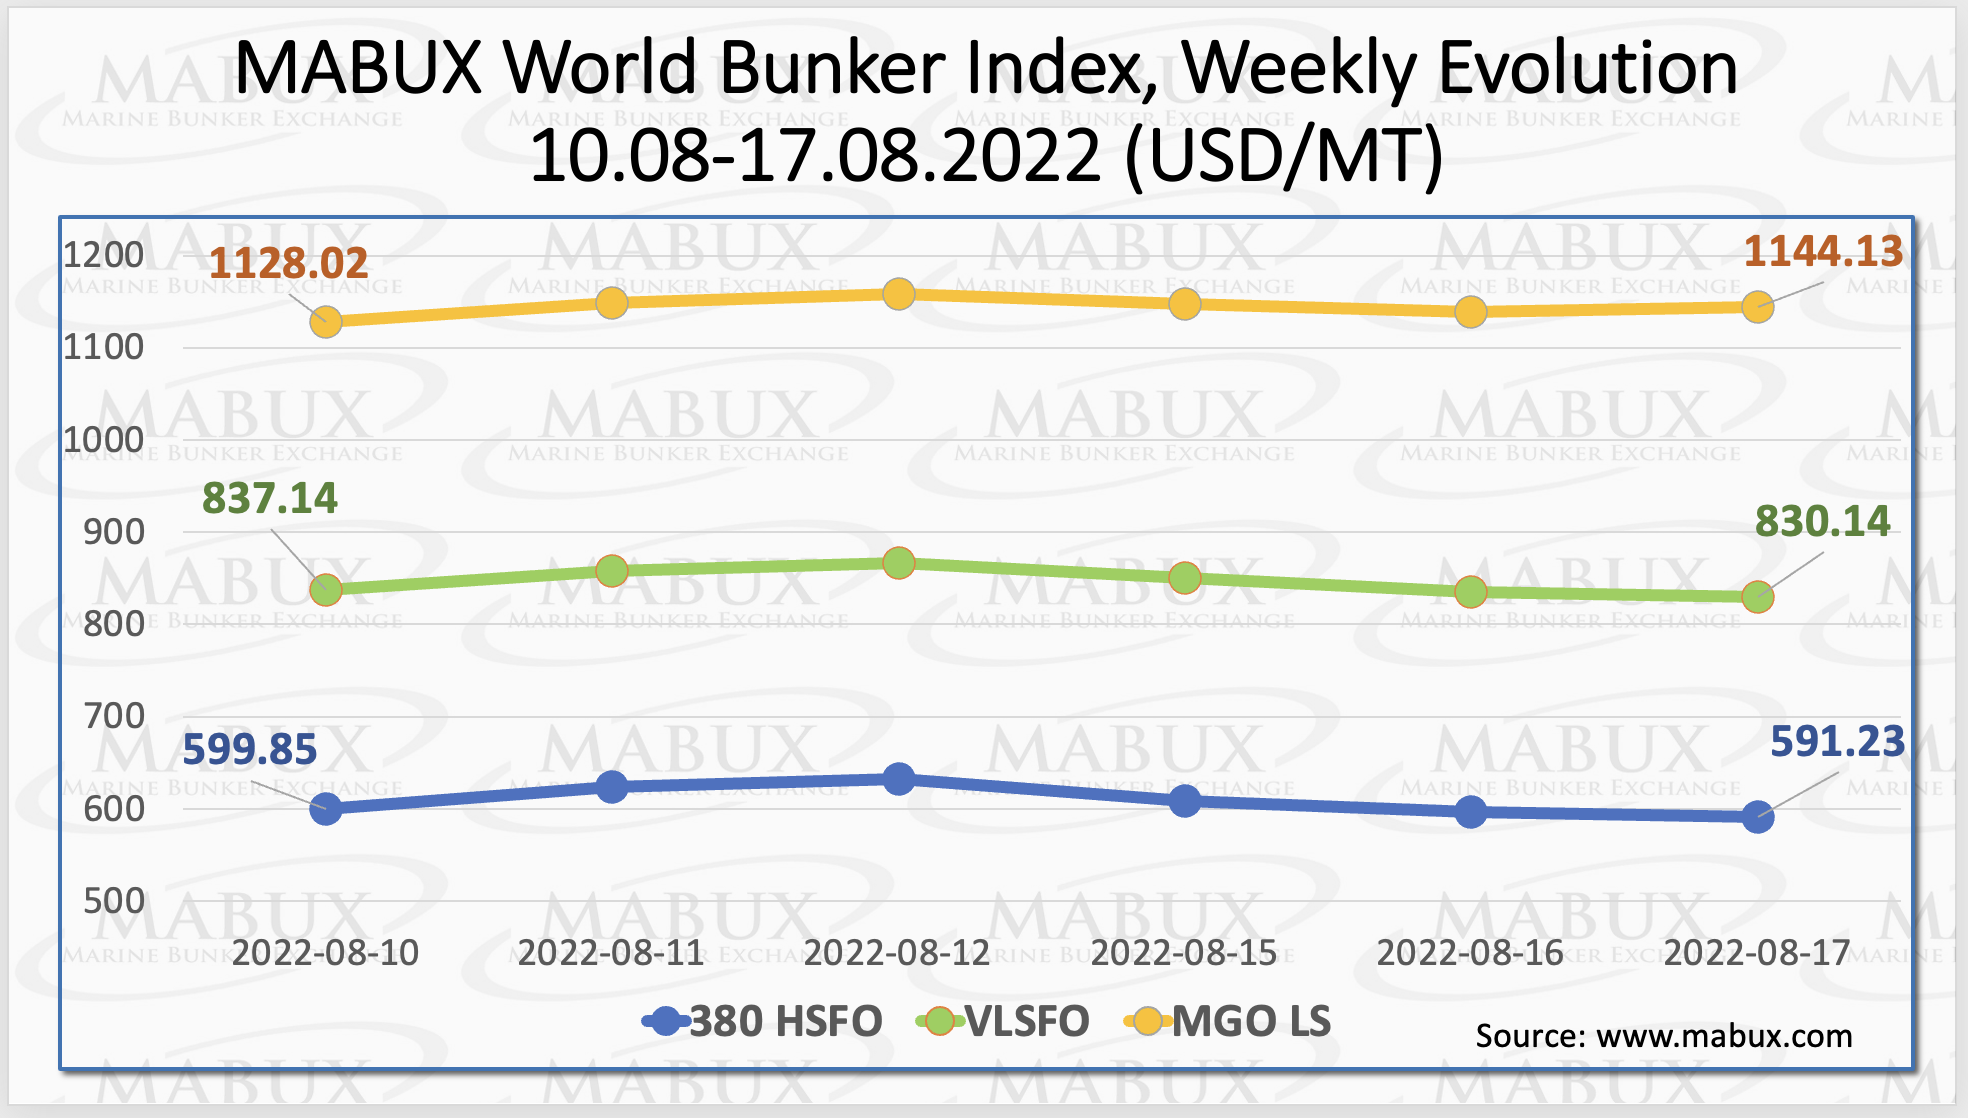
Bunker-Weekly-Outlook

MABUX: Bunker Weekly Outlook, Week 33, 2022

August 18, 2022
Global-Maritime-Hub- Logo

Maritime market intelligence platform featuring 2,200+ reports, presentations and industry insights, with new content added every week. more info

Categories

  • Shipping Economic Trends & Regions
  • Ports & Terminals
  • Piracy & Security
  • Emissions, Fuel Technology & Environment
  • Economic Impact
  • Financing
  • Ship Building
  • Hinterland & Intermodal
  • Port Environmental Impact
  • Shipping Workforce

Recent Analysis

Transpacific spot rates make China–US West Coast the most lucrative major trade

Liner service instability rises sharply on major trade lanes

Asia-Europe container capacity reaches unprecedented levels

Weekly Updates

Sign up to receive our weekly newsletter (each Thursday) with new shipping industry market reports, presentations & analysis.

Your subscription could not be saved. Please try again.
Your subscription has been successful.

By signing up, I agree to our TOS and Privacy Policy.

© 2026 GlobalMaritimeHub | All Rights Reserved

X-twitter Linkedin Youtube
Manage Consent
To provide the best experiences, we use technologies like cookies to store and/or access device information. Consenting to these technologies will allow us to process data such as browsing behavior or unique IDs on this site. Not consenting or withdrawing consent, may adversely affect certain features and functions.
Functional Always active
The technical storage or access is strictly necessary for the legitimate purpose of enabling the use of a specific service explicitly requested by the subscriber or user, or for the sole purpose of carrying out the transmission of a communication over an electronic communications network.
Preferences
The technical storage or access is necessary for the legitimate purpose of storing preferences that are not requested by the subscriber or user.
Statistics
The technical storage or access that is used exclusively for statistical purposes. The technical storage or access that is used exclusively for anonymous statistical purposes. Without a subpoena, voluntary compliance on the part of your Internet Service Provider, or additional records from a third party, information stored or retrieved for this purpose alone cannot usually be used to identify you.
Marketing
The technical storage or access is required to create user profiles to send advertising, or to track the user on a website or across several websites for similar marketing purposes.
  • Manage options
  • Manage services
  • Manage {vendor_count} vendors
  • Read more about these purposes
View preferences
  • {title}
  • {title}
  • {title}